Table Grid — Goal and Objective Tracker
Bunlong Heng
February 16, 2026
OKRs, sprints, quarterly goals — structured planning always needs a visual artifact. Table Grid converts your markdown outline into a color-coded tracker without any manual formatting.
What it does
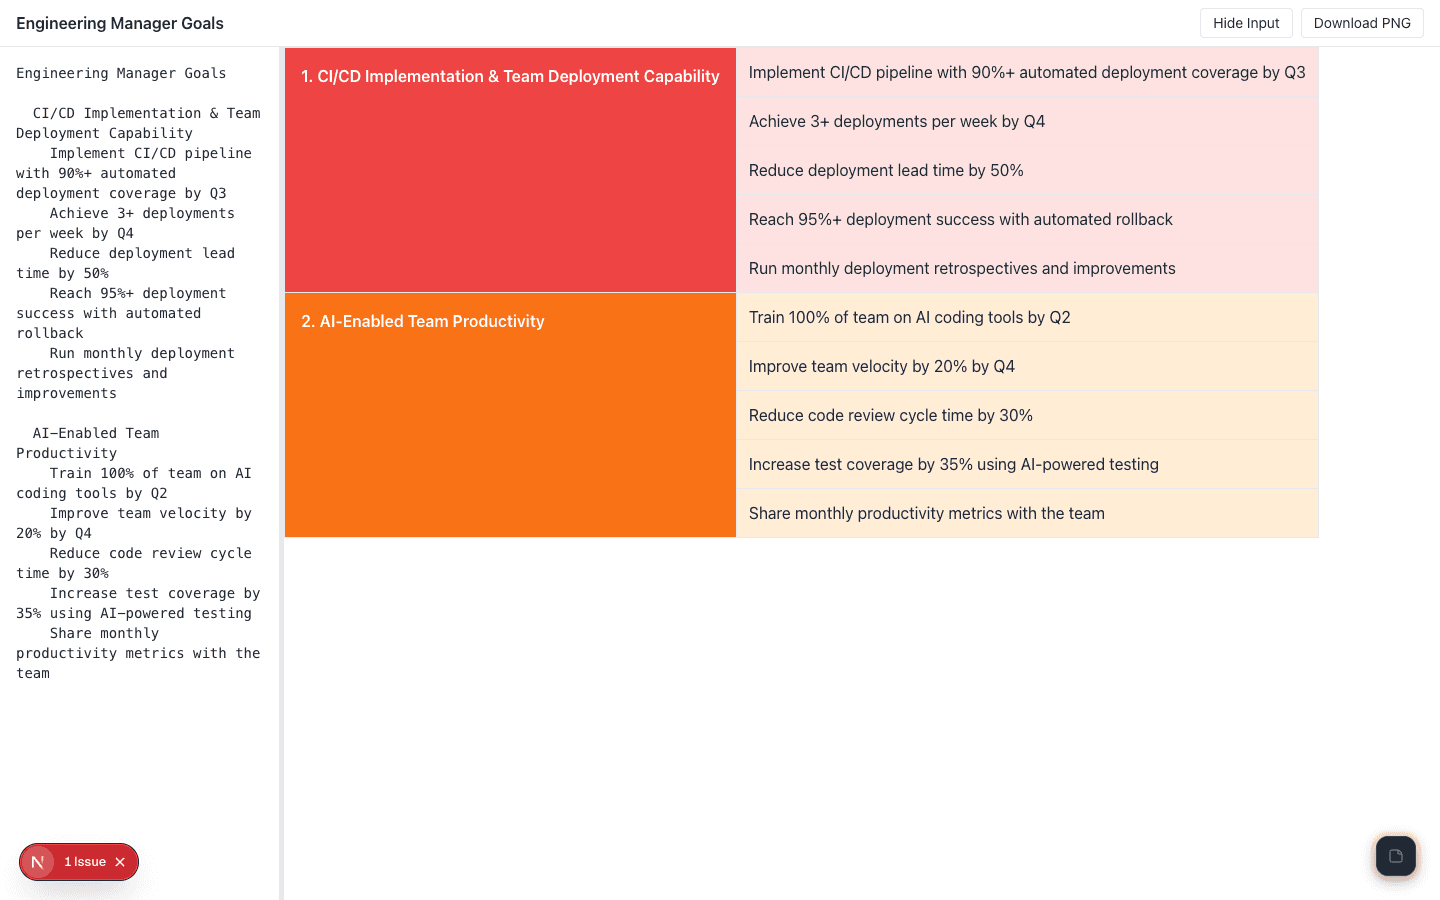
Paste markdown with sections (objectives) and bullet points (key results or tasks). Table Grid renders each section as a color-coded row in a grid. Items appear as cells within each row.
The canvas is draggable — pan to any section of a large grid. Export as PNG for slides, retrospectives, or planning documents.
Input format
Each ## section gets a row with a distinct color. Items become cells.
Split input pane
The editor and the preview sit side by side. Edits update the grid in real-time — you see the result as you type.
Comments
Be the first to leave a comment.
Related Posts