
notessupabasereal-timeproductivity
Stickies
A personal notes board that got ambitious — real-time sync, six view modes, burn-after-read sharing, smart home automation, and a sound design system built from scratch.
March 31, 2026Read →
bheng / blog
Behind the tools — how and why I built each one.
Featured
A personal notes board that got ambitious — real-time sync, six view modes, burn-after-read sharing, smart home automation, and a sound design system built from scratch.
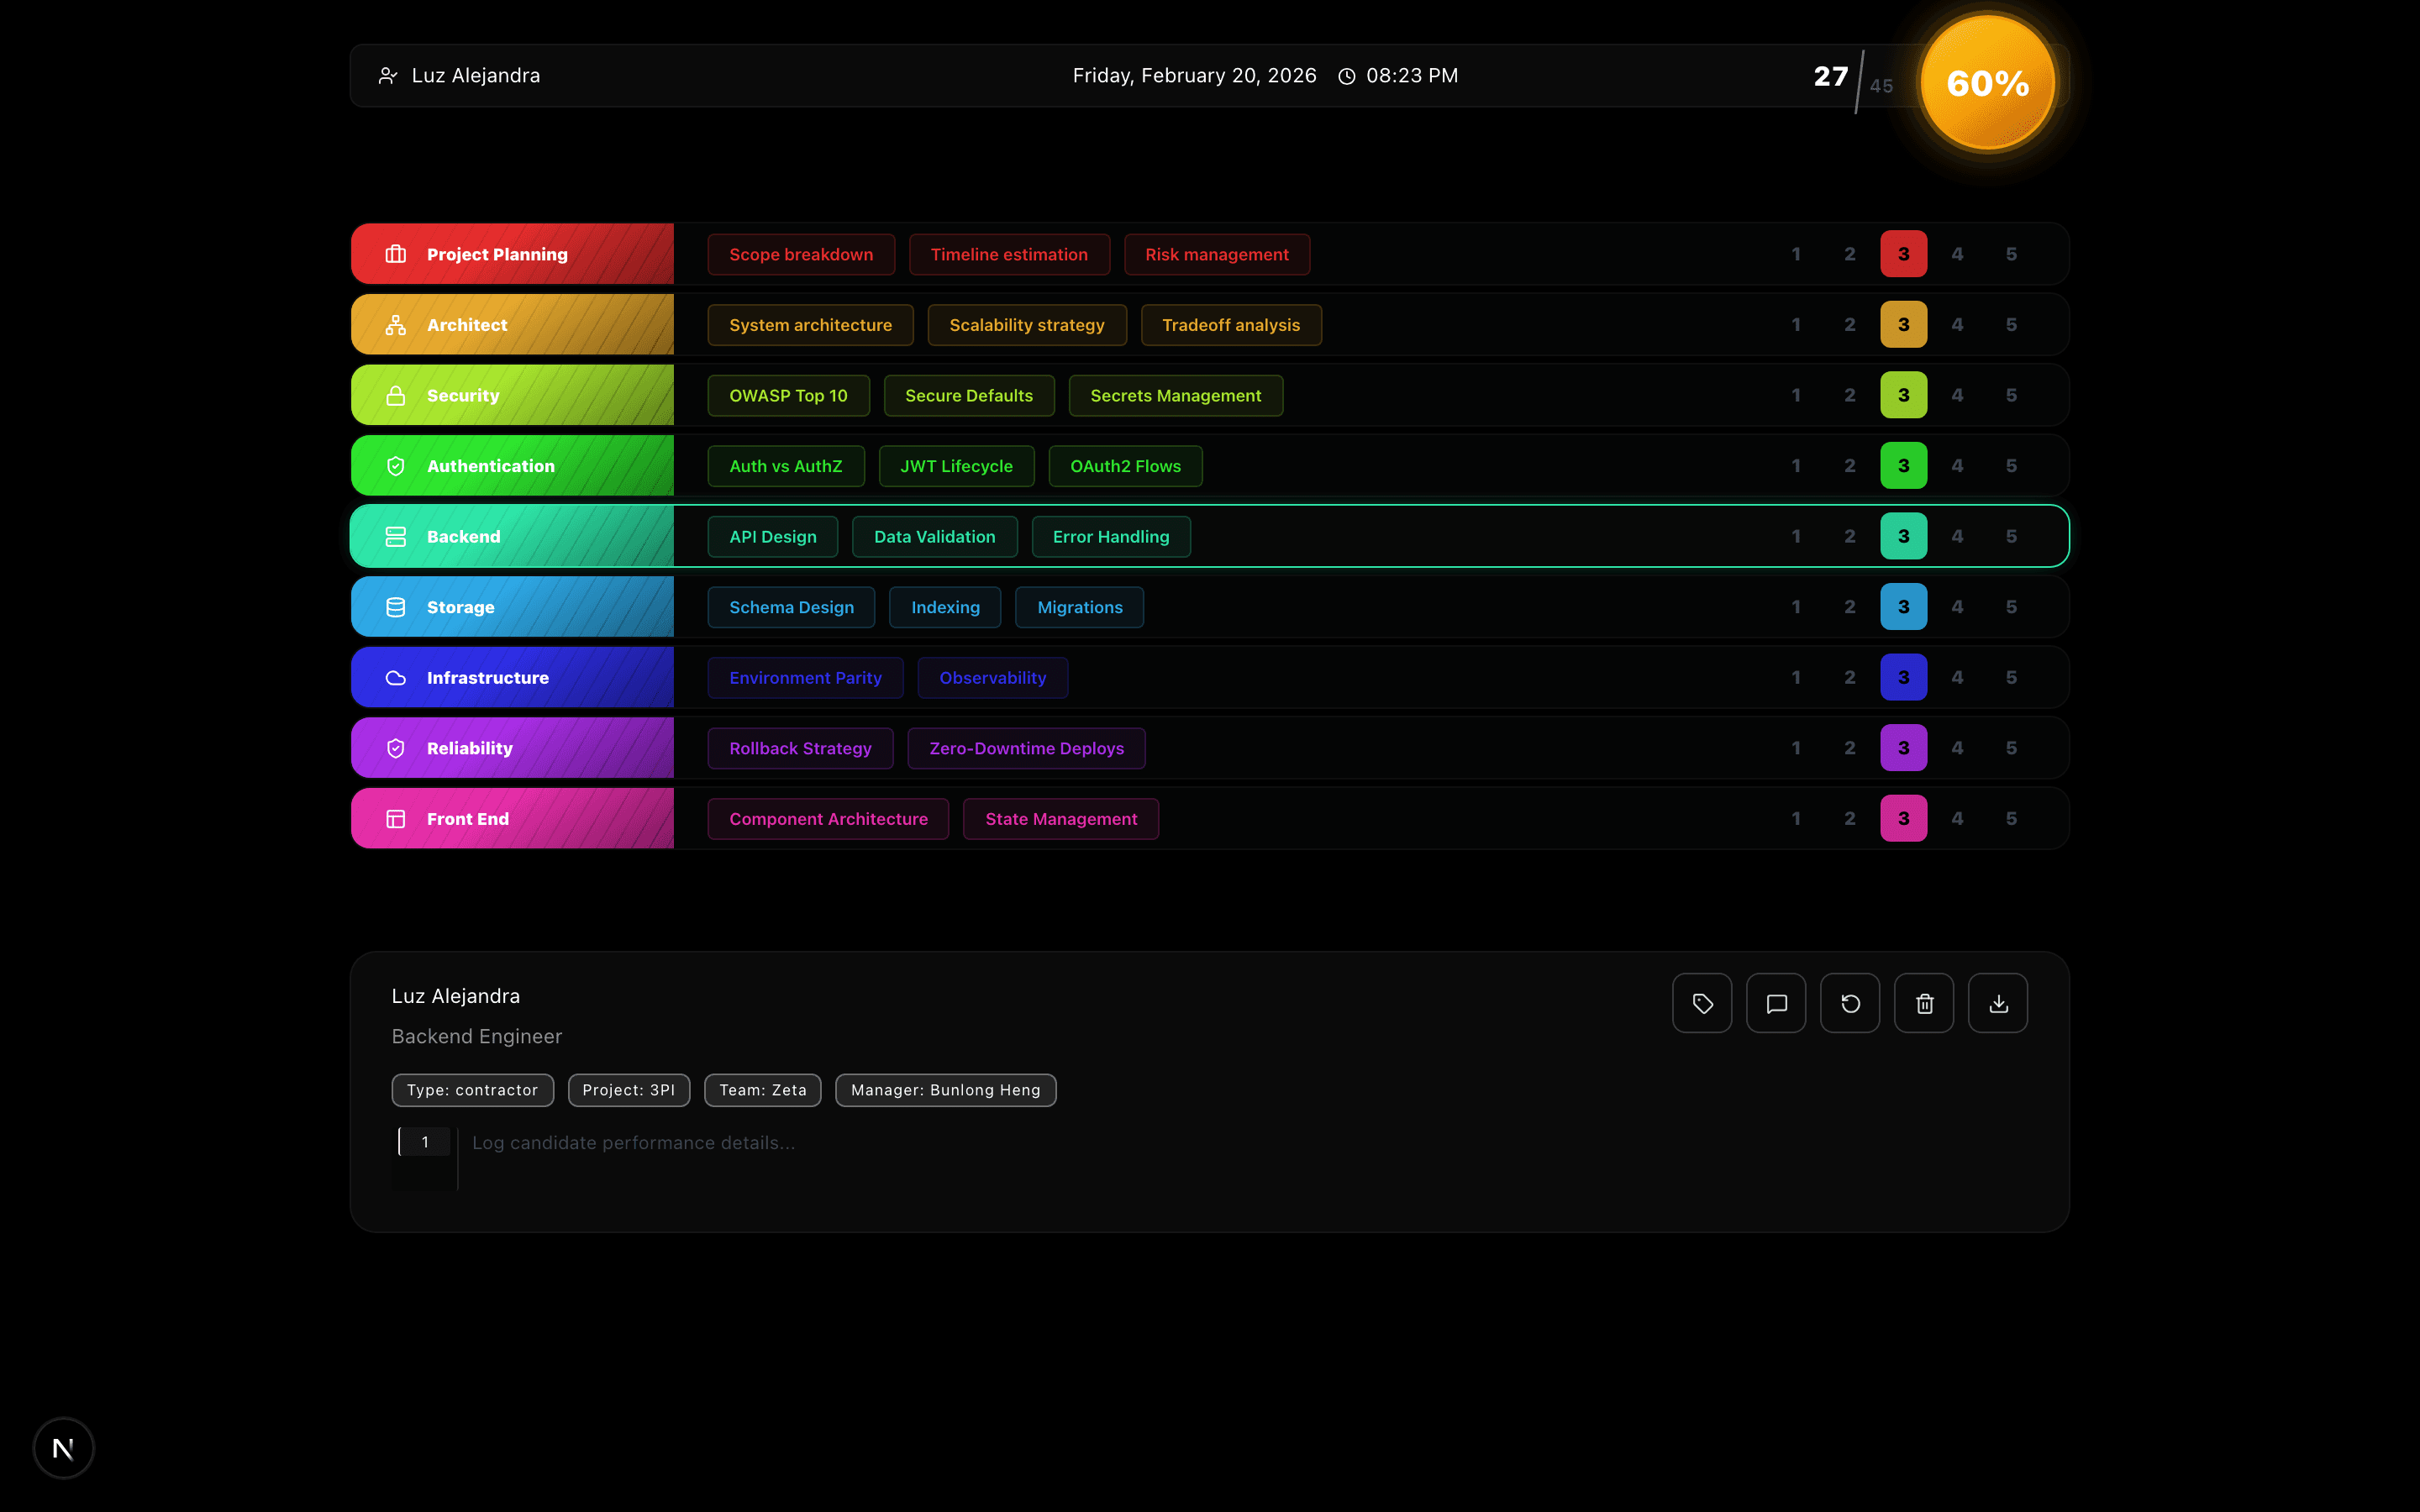
A structured, rubric-driven technical interview scoring tool with topic Q&A, AI-generated feedback, a 60-second per-topic timer, and PNG export.
Mermaid is a great spec format. The default renderer is not a great renderer. Mermaid++ keeps the syntax, replaces the output, and adds the editing experience Mermaid should have shipped with.
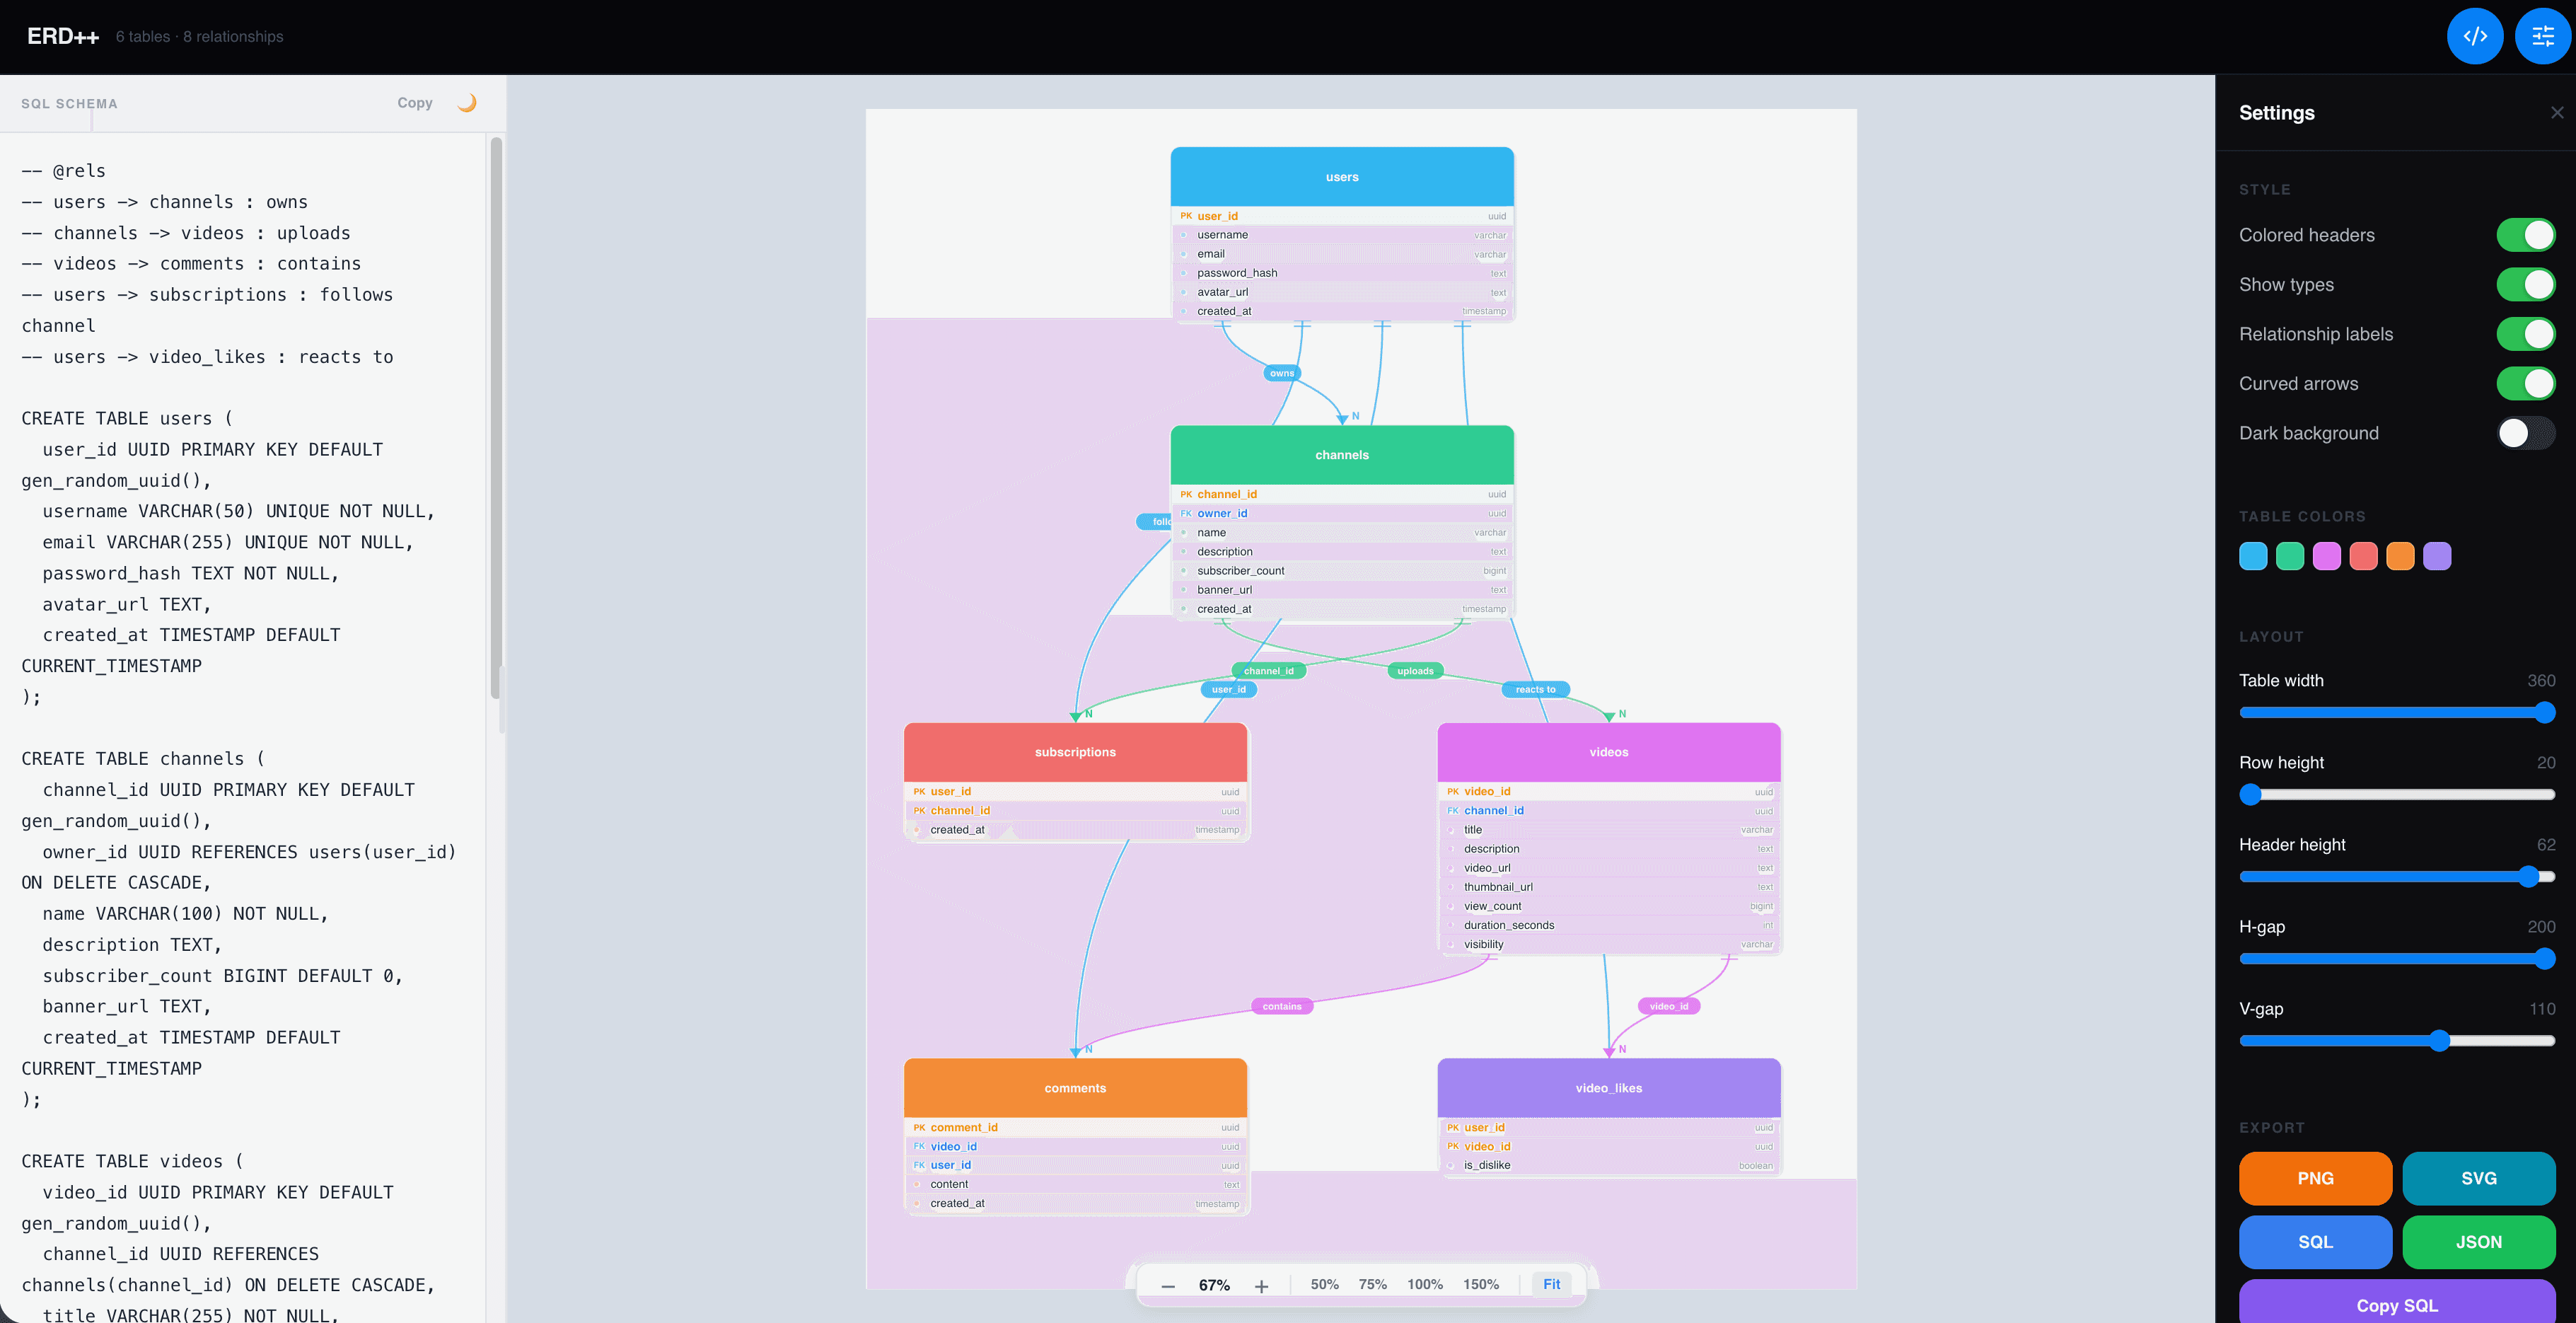
Paste a CREATE TABLE statement and a live, interactive Entity Relationship Diagram appears — no drag-and-drop, no manual wiring, no third-party chart library doing the heavy lifting.

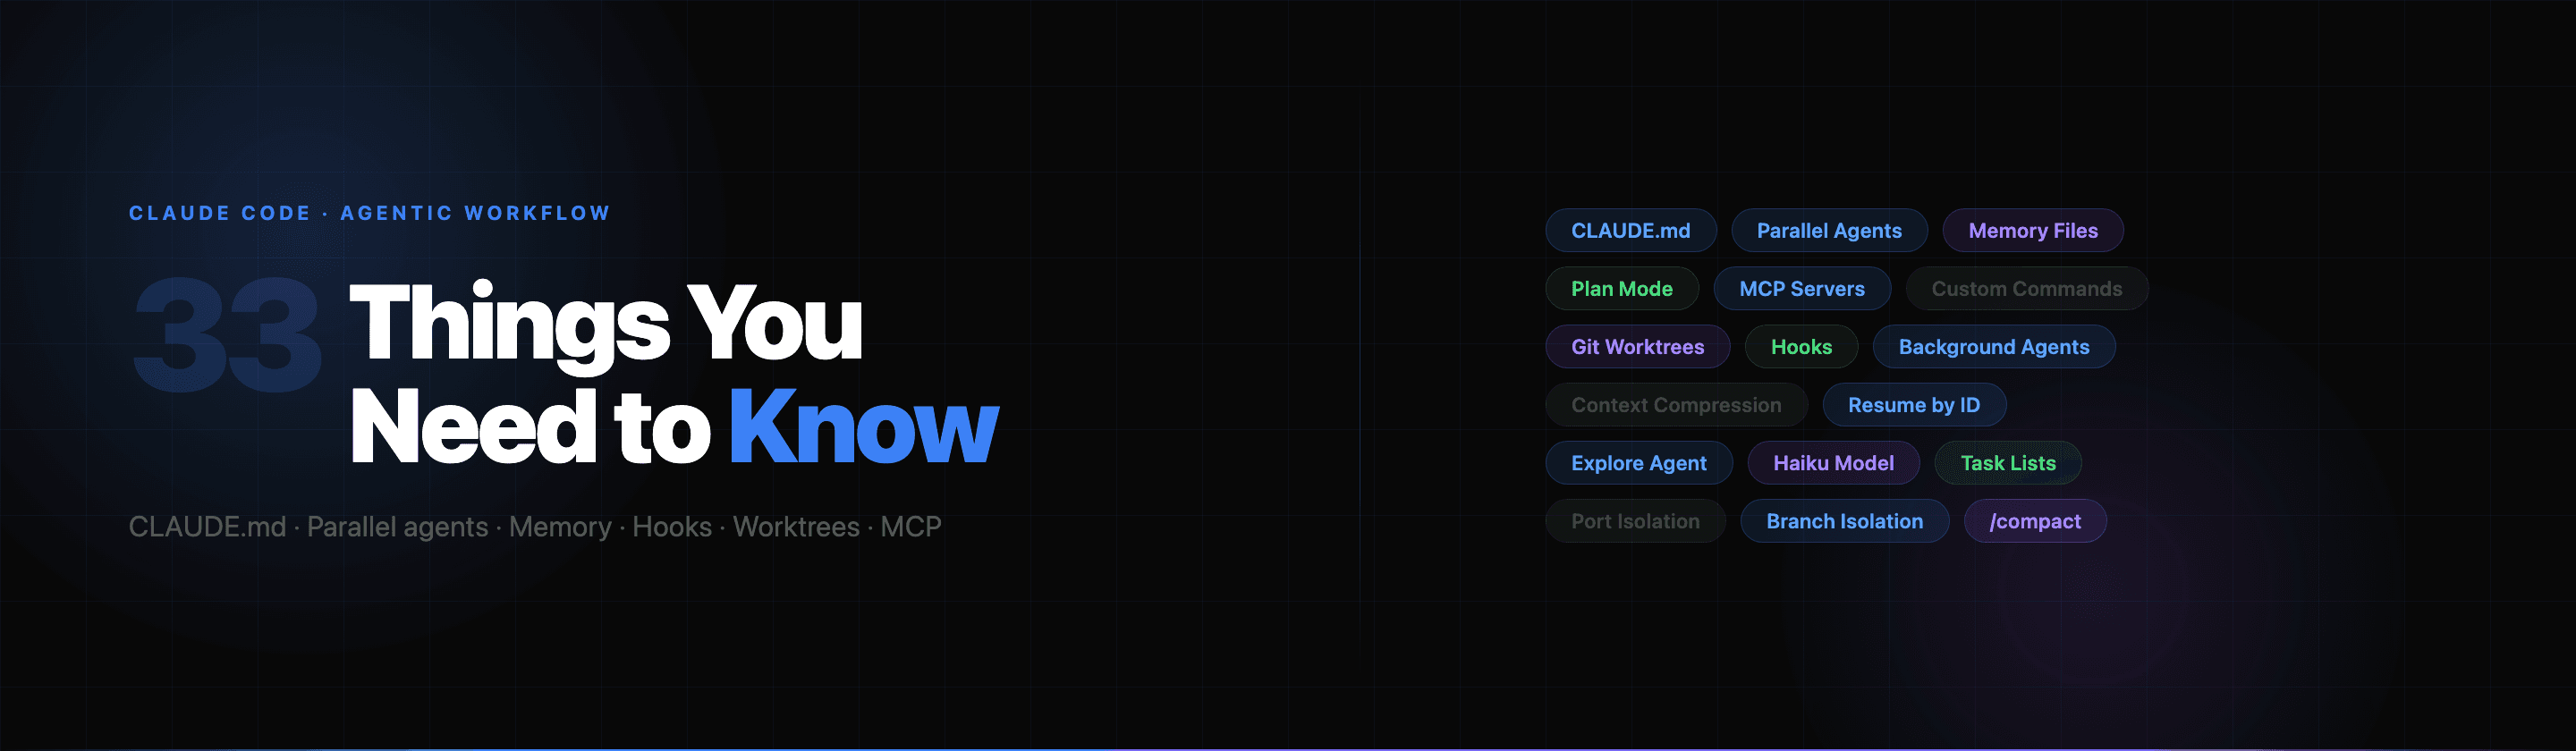
Claude Code is more than an AI autocomplete. These 33 tips unlock the full agentic workflow — from CLAUDE.md context files and parallel subagents to memory persistence and MCP server extensions.
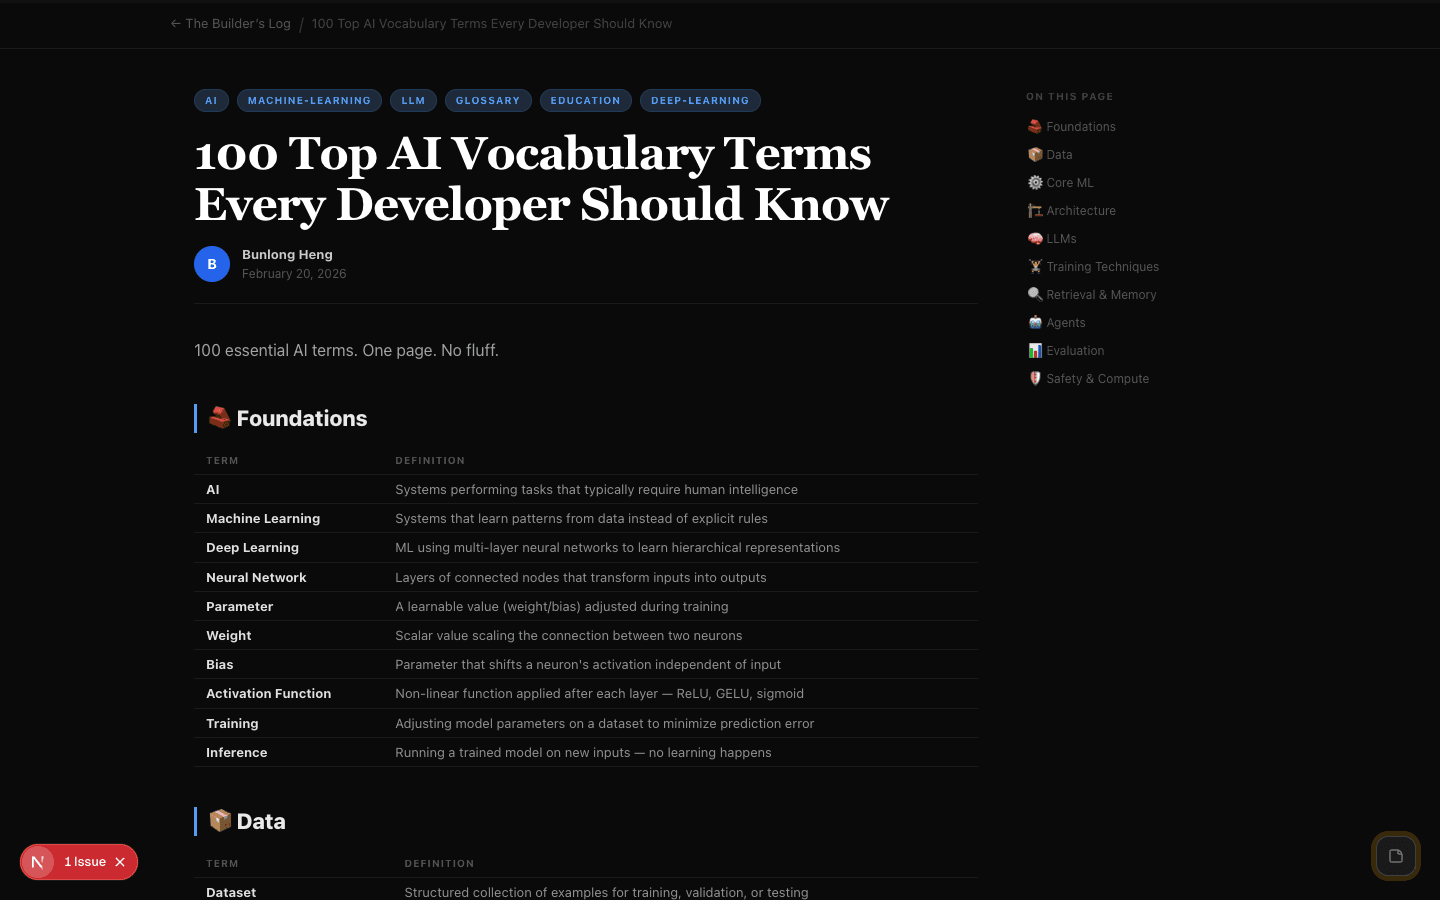
From tokens and transformers to RLHF and RAG — 100 essential AI terms in one compact reference. Bookmark it.
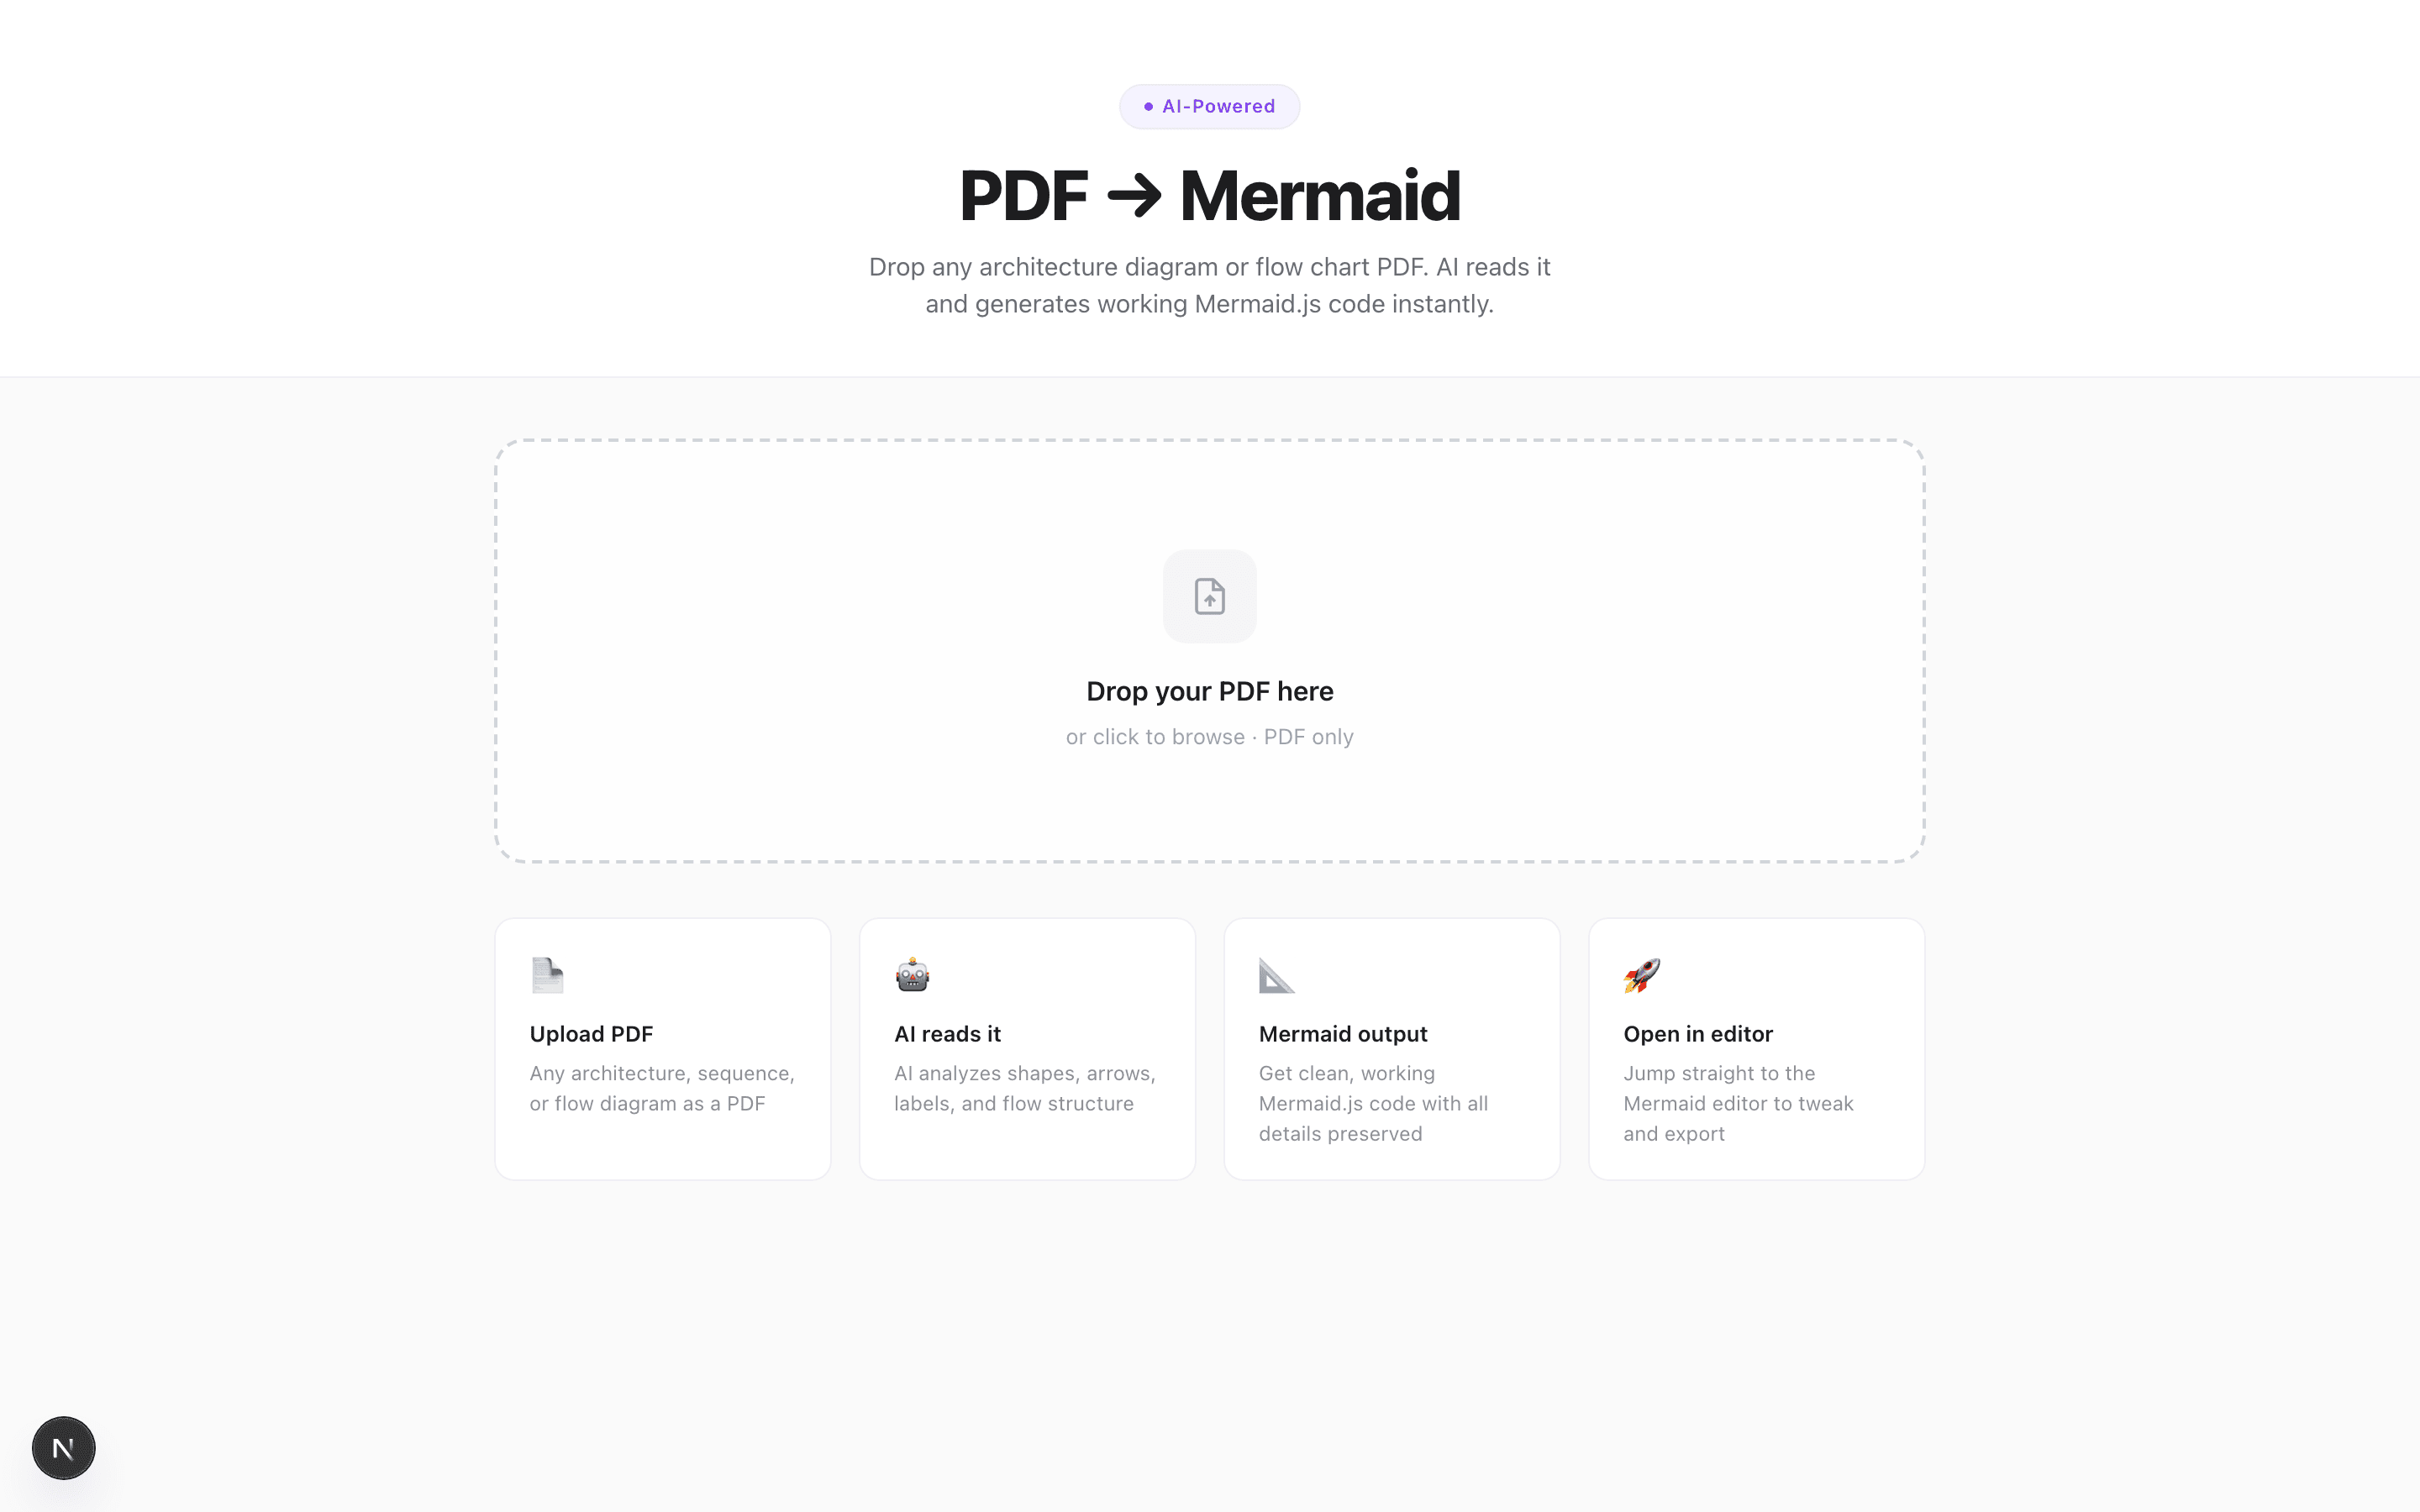
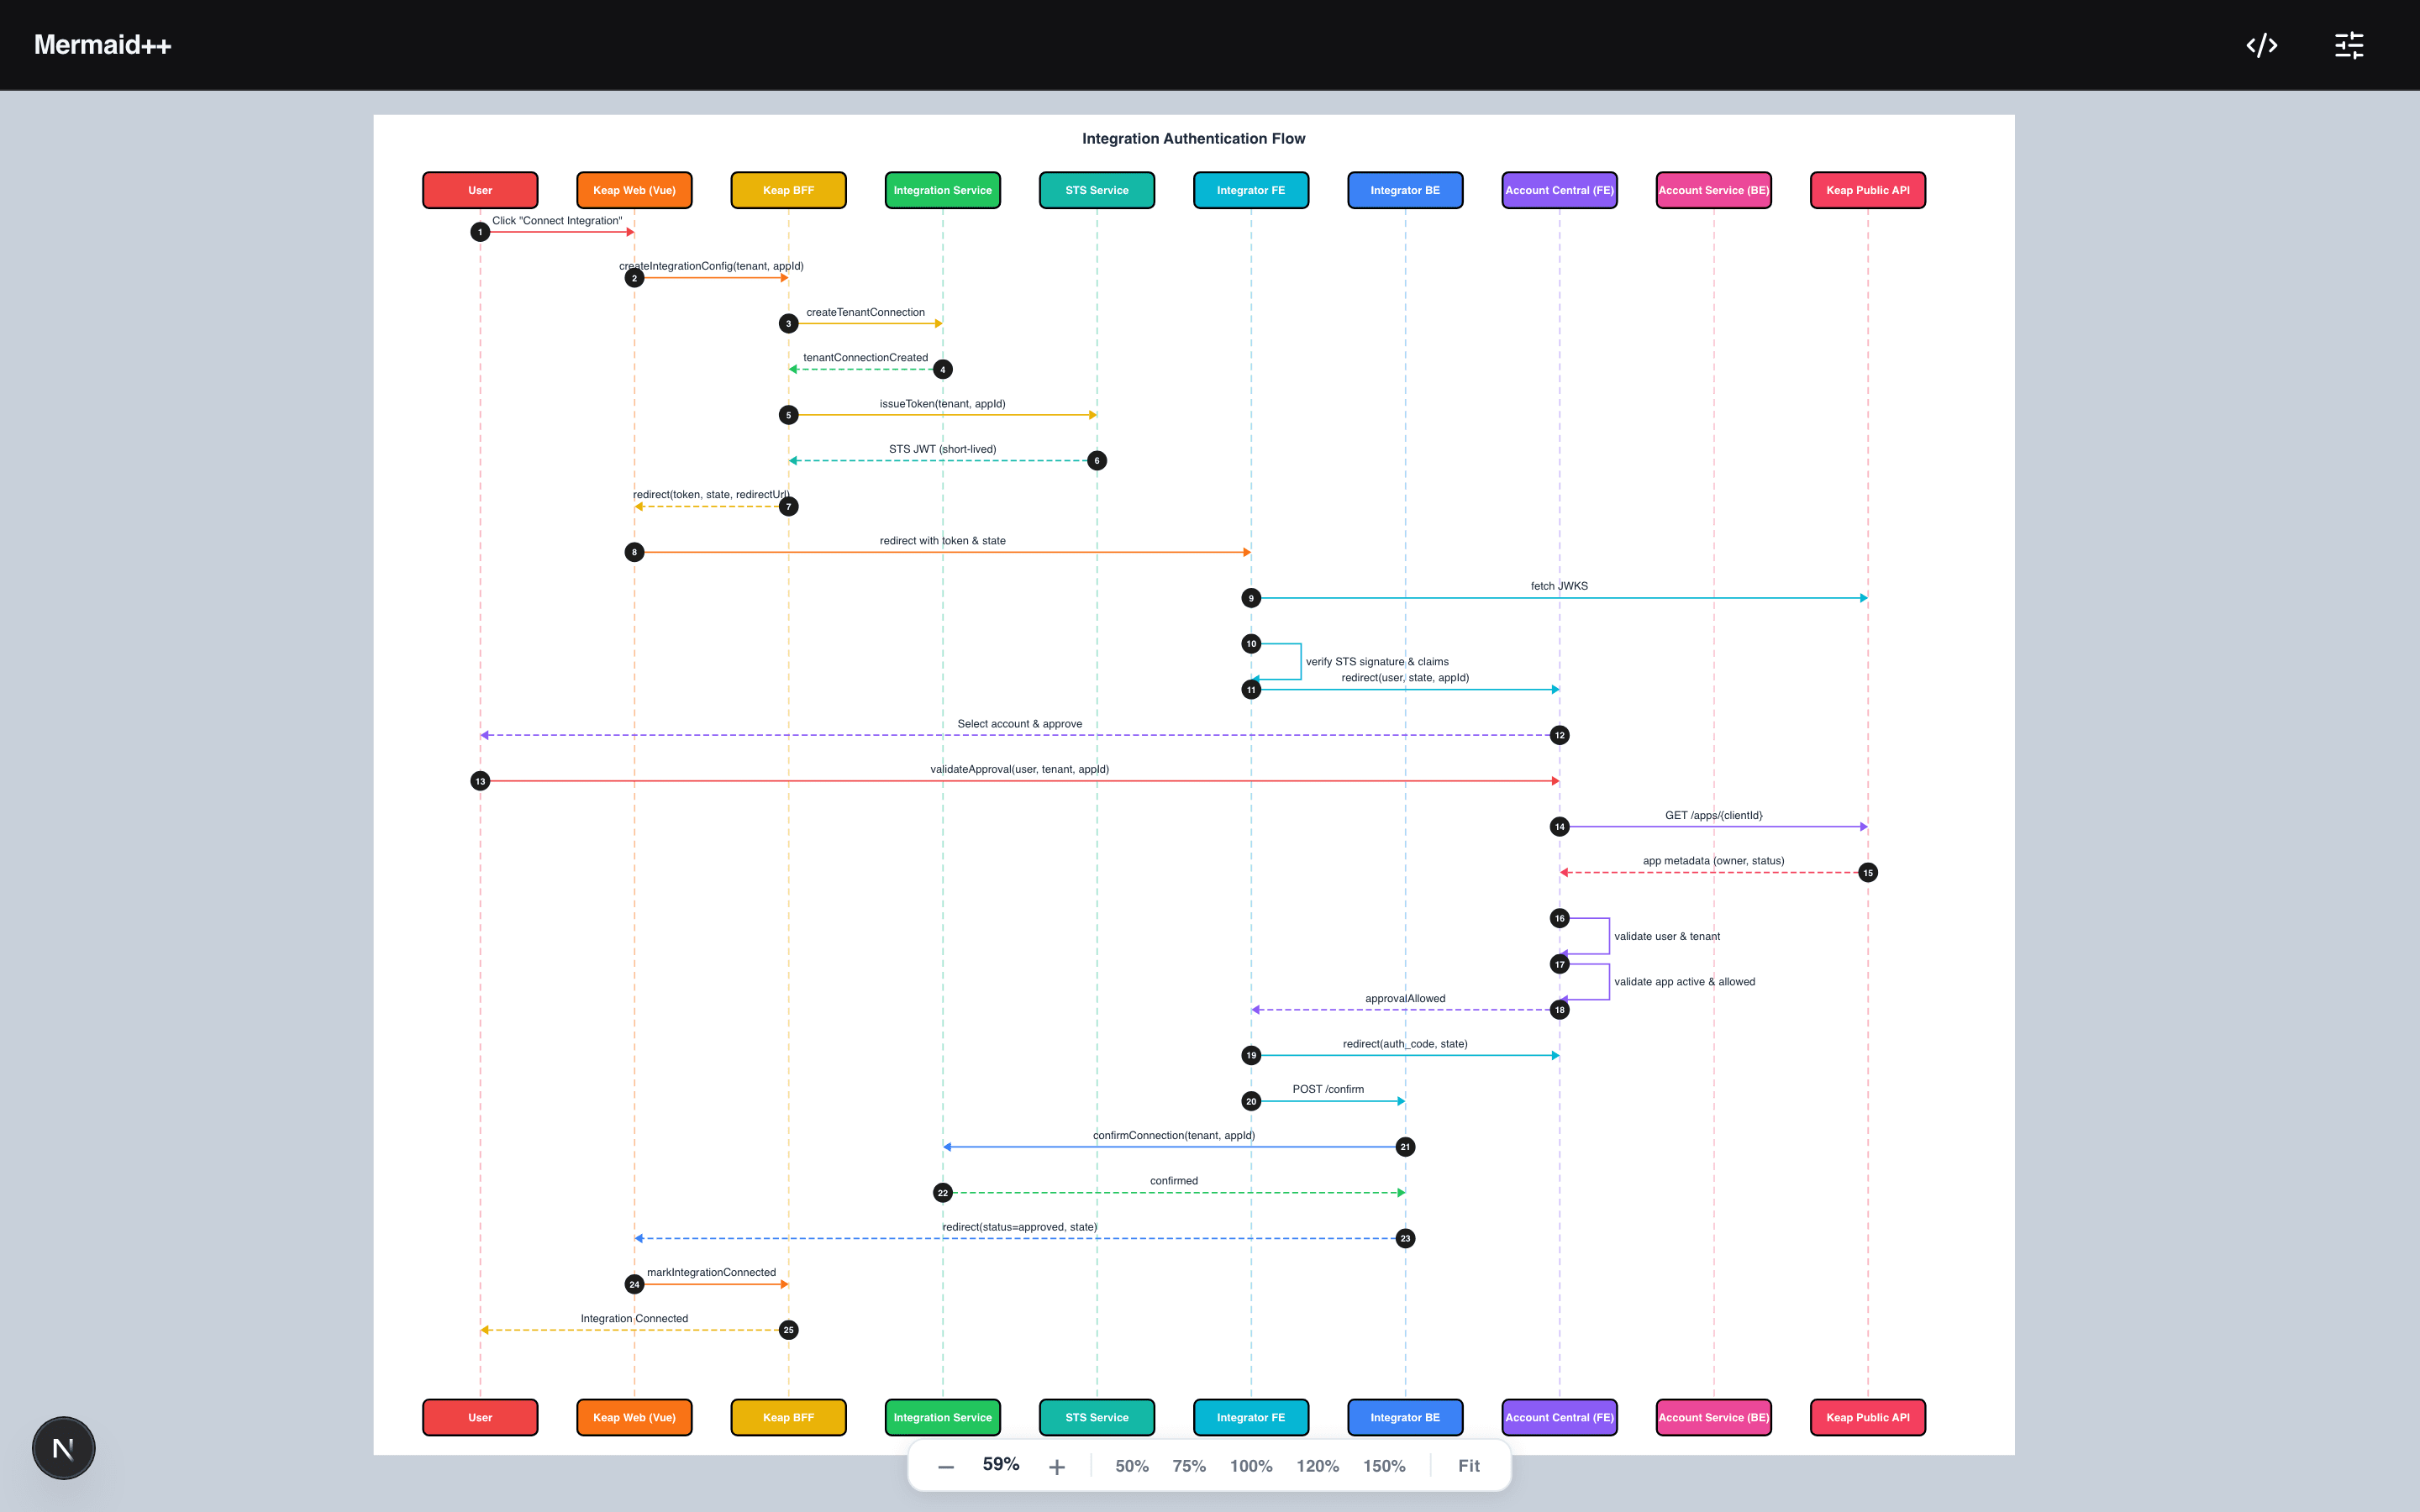
Drag a PDF architecture diagram onto the page and get clean Mermaid.js sequence code back — powered by OpenAI vision.
More Builds
Skipping these 8 habits is why most beginners fight Claude Code instead of letting it work for them. Start here.
March 7, 2026
Setting up CLAUDE.md files and naming AI agents with specific roles isn't just housekeeping — it's a real systems design pattern used in production AI. Here's what you're actually building.
February 21, 2026
Four distinct visual renderers for the same input: a radial mind map, a circular layout, an elliptical node graph, and a donut ring. Pick the one that fits your content.
February 17, 2026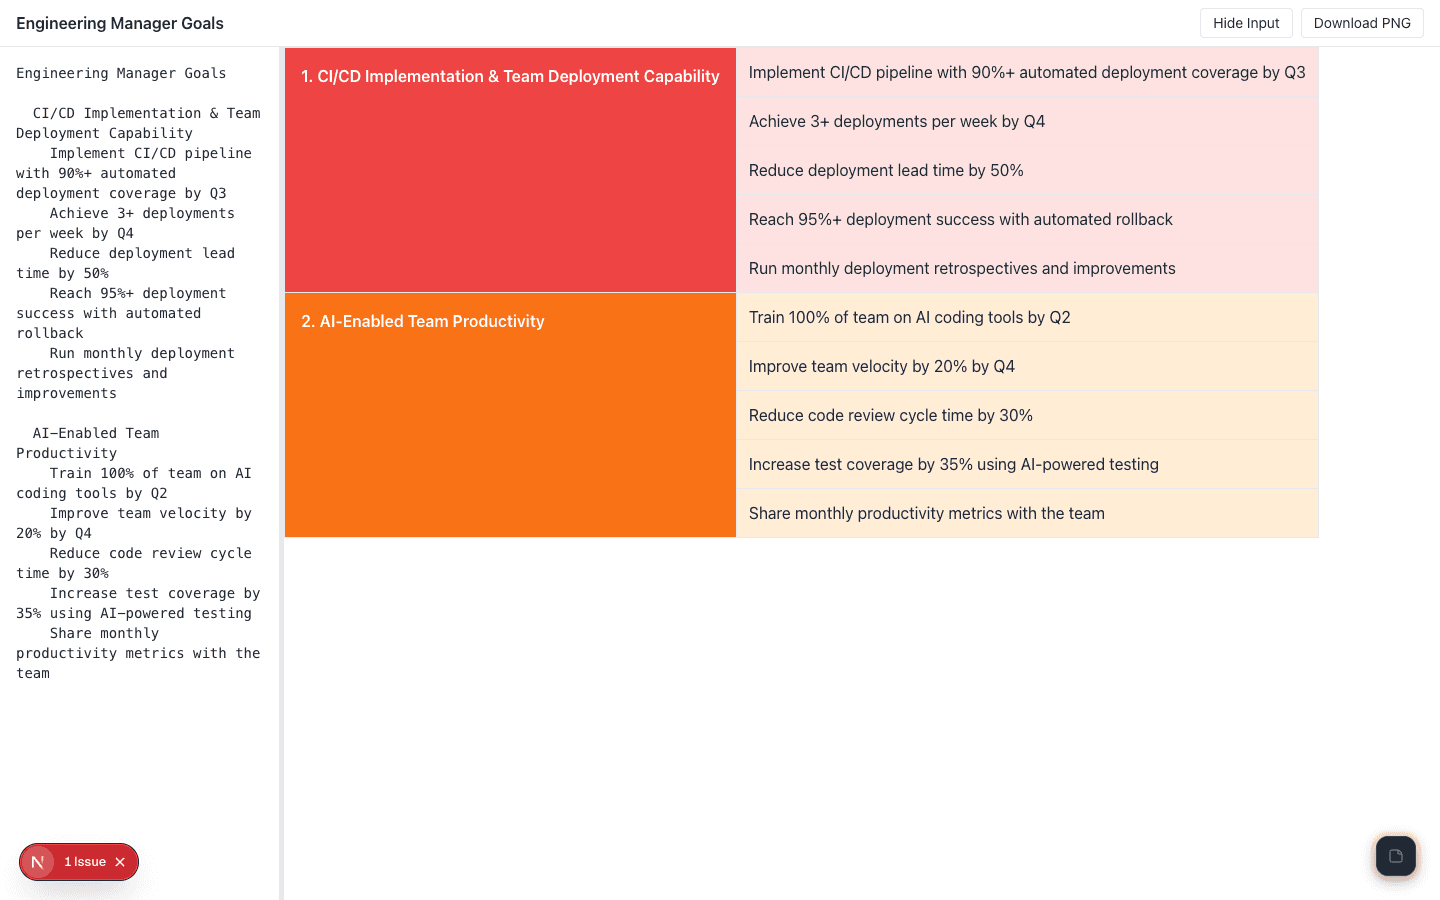
Paste a markdown outline — get a color-coded goal tracker grid. Drag to pan, export as PNG. Built for OKR-style planning and structured objective tracking.
February 16, 2026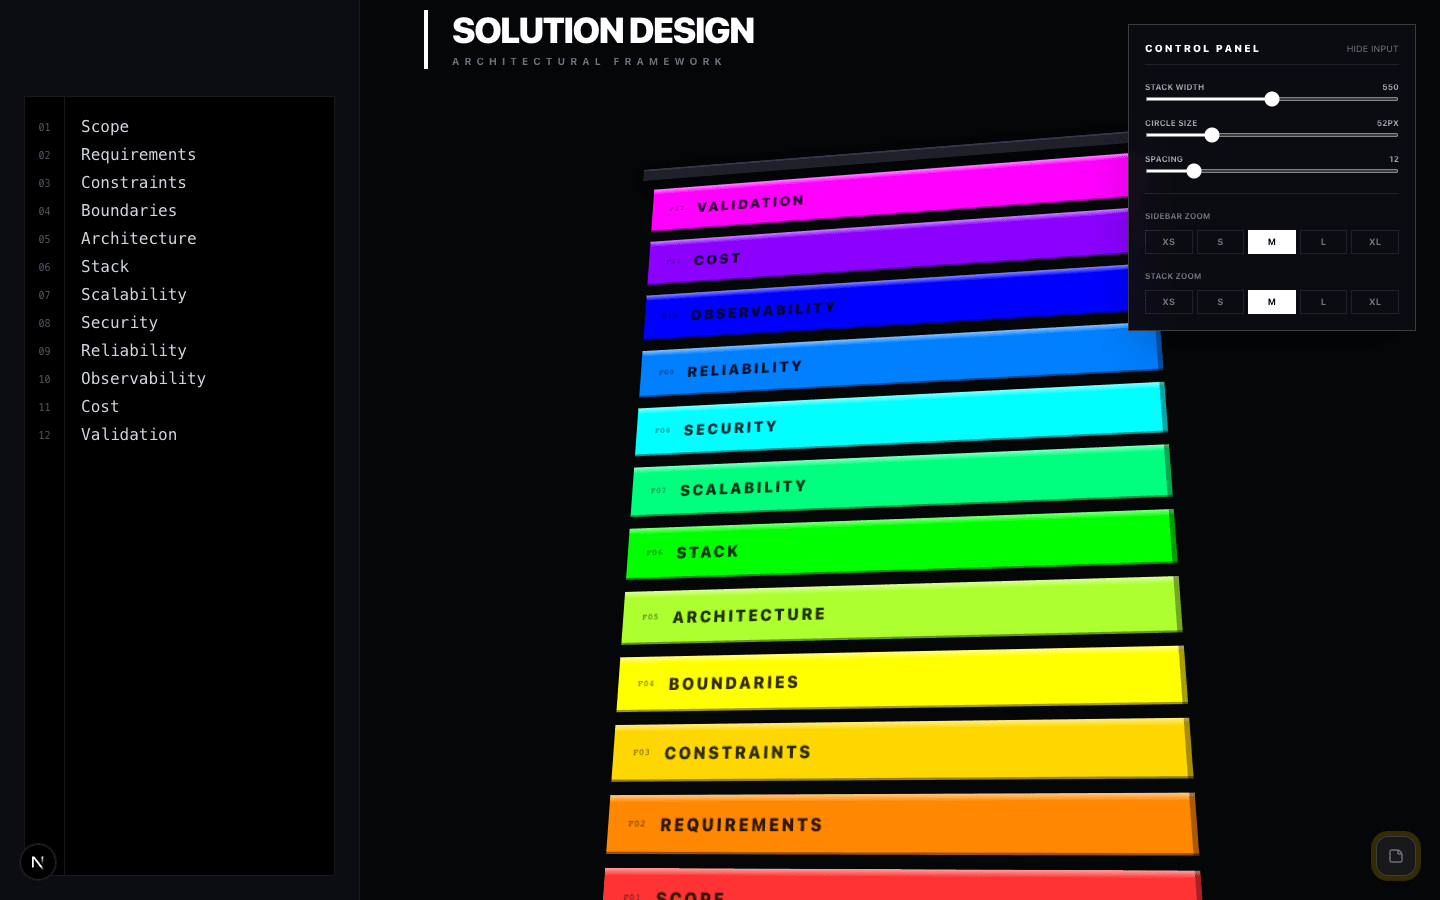
Turn a 12-item list into a 3D stacked bar with perspective tilt. Each layer is a distinct color. Export as PNG for architecture decks and presentations.
February 15, 2026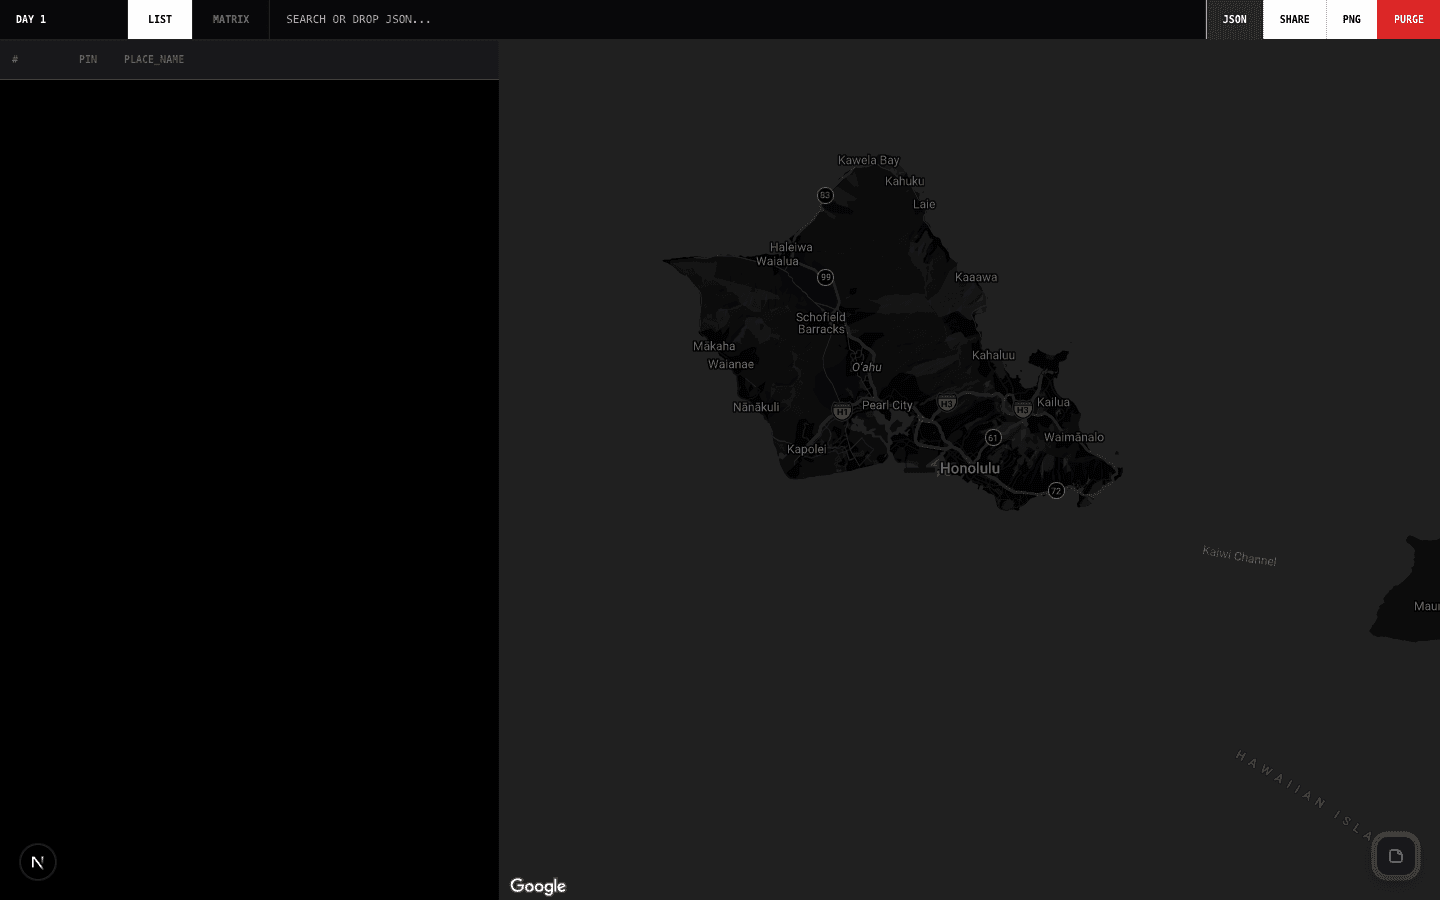
The production-grade sibling of Distances. Manage multiple locations on a map, calculate pairwise distances in a full matrix view, import and export JSON.
February 14, 2026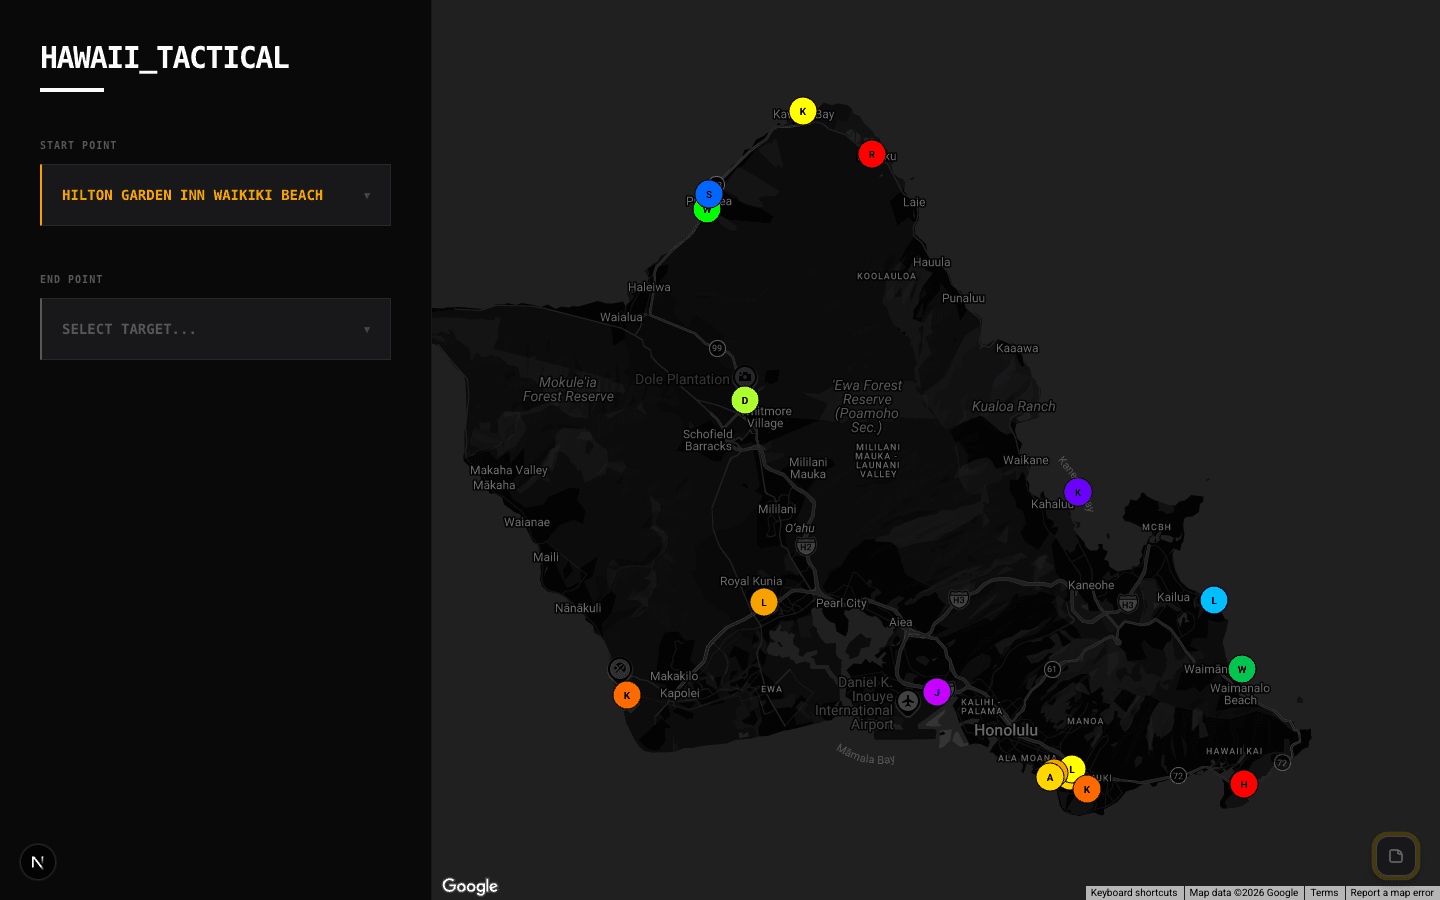
Select start and end points from a curated list of Hawaiian destinations. See the route, driving distance, and duration with animated polylines on Google Maps.
February 13, 2026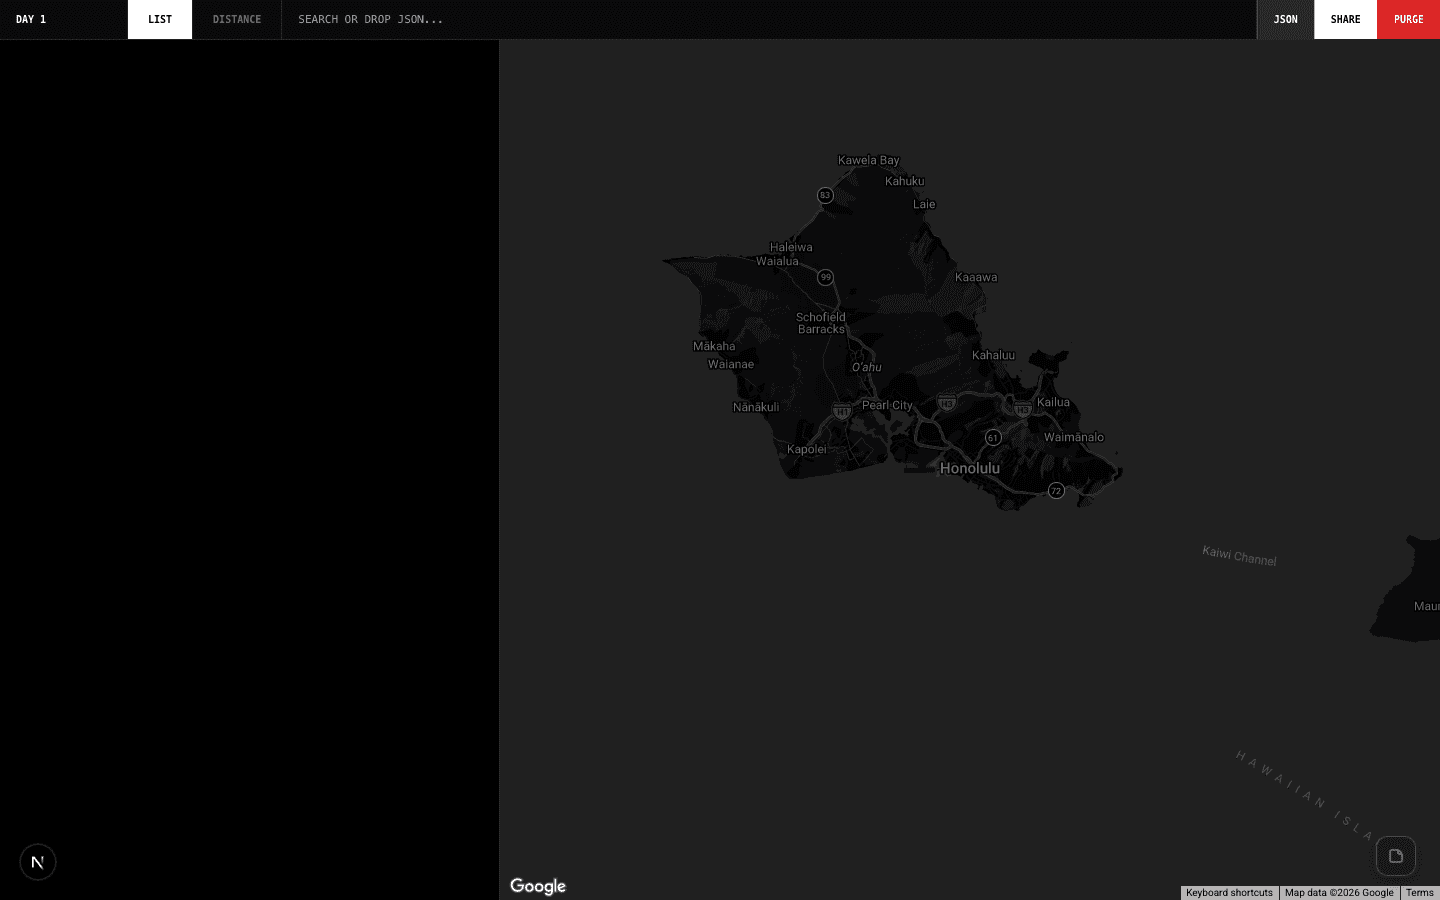
Add locations via autocomplete, visualize on a map, calculate driving distances and durations between every point. Export, import, and share via URL.
February 12, 2026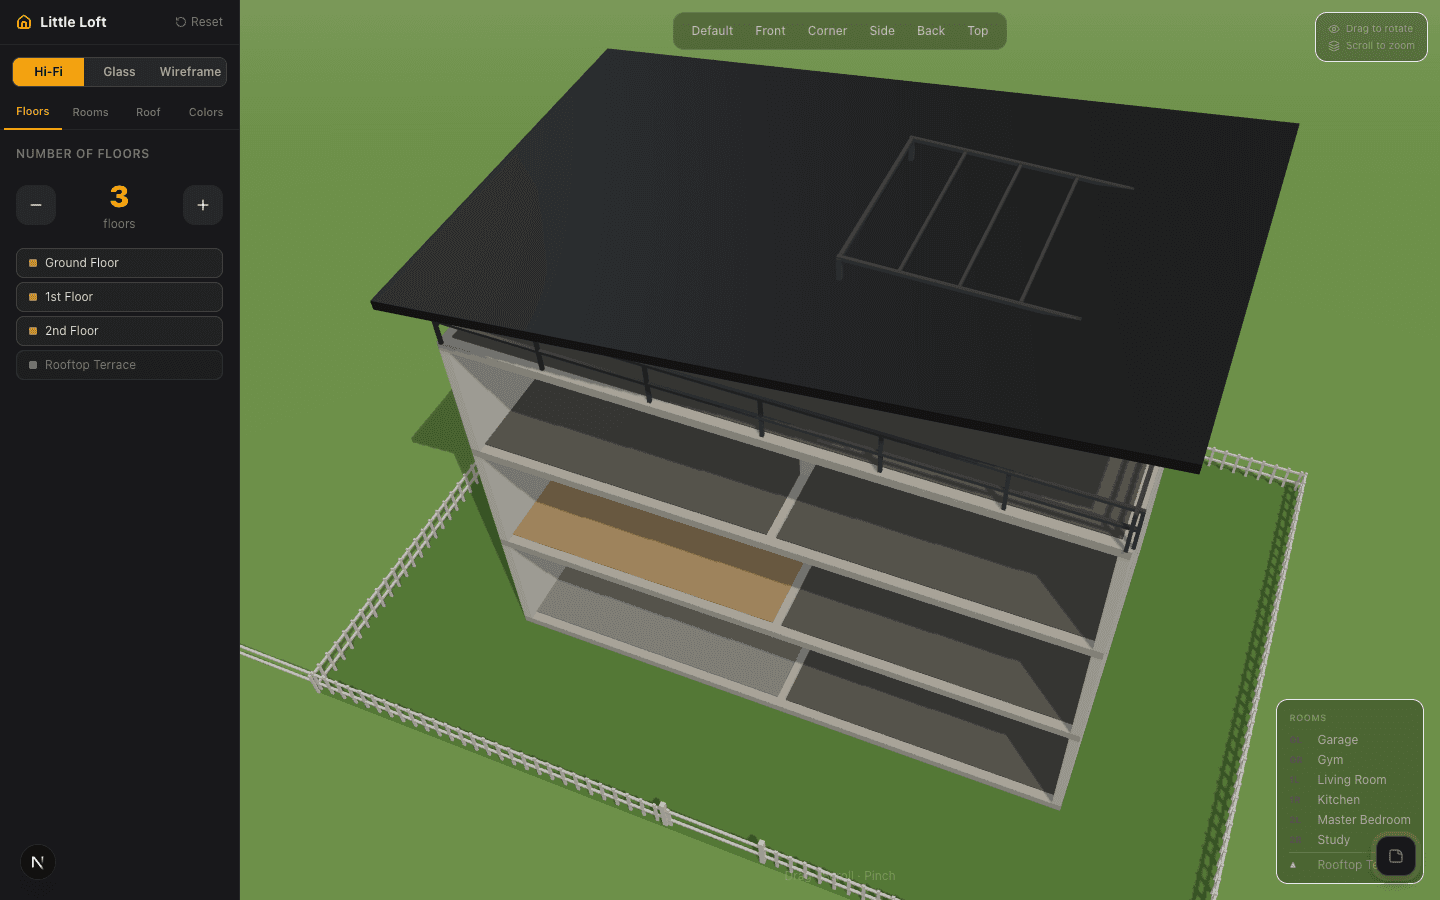
Design multi-story homes in the browser. Choose 1-4 floors, name rooms, pick roof style, set wall and roof colors — rendered in 3D with Three.js in hi-fi, glass, or wireframe.
February 11, 2026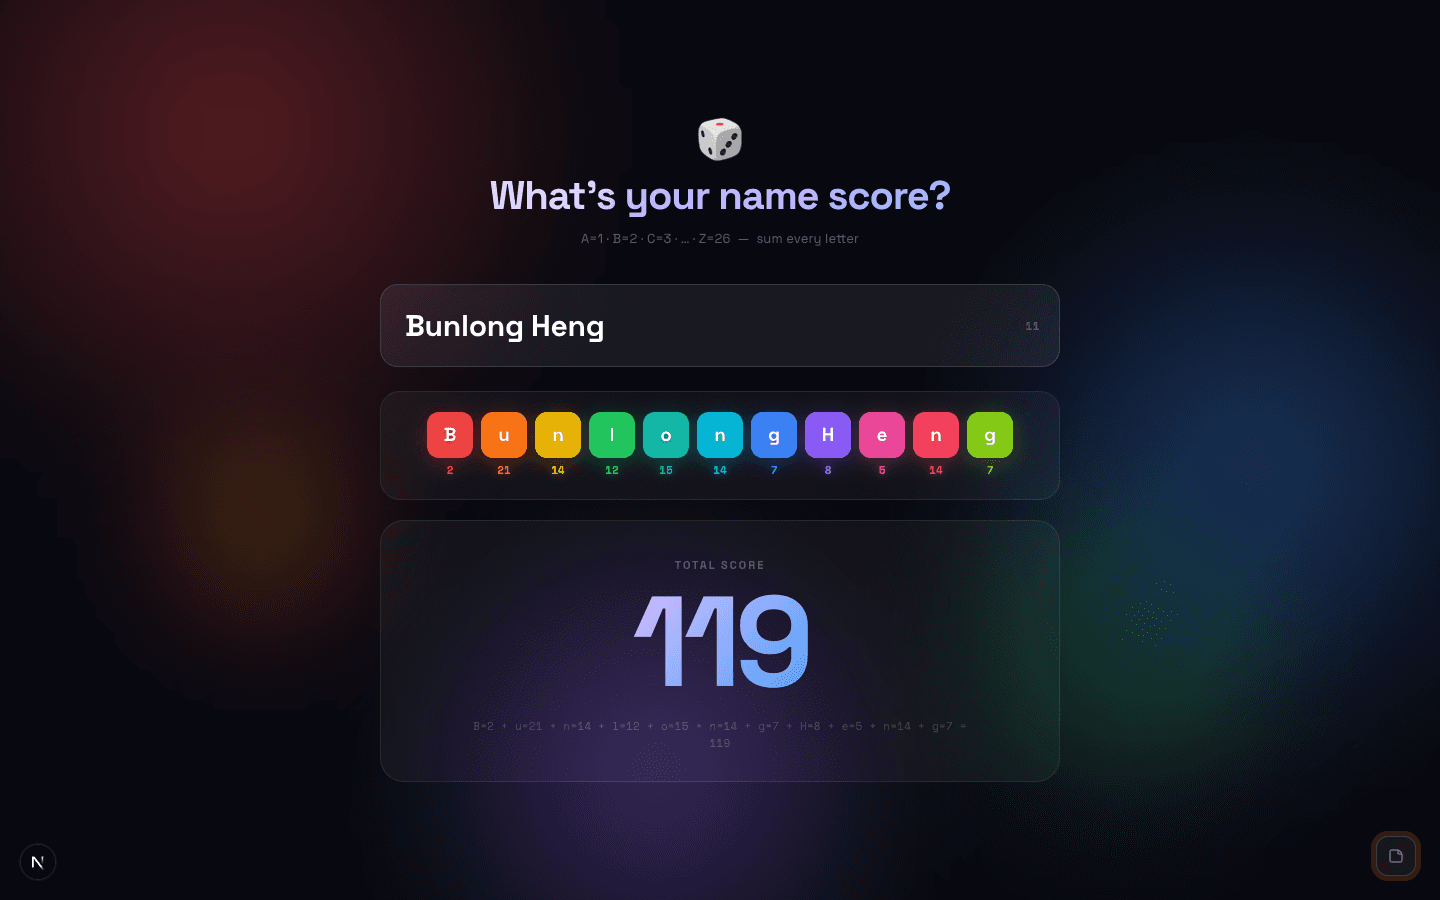
A=1, B=2, ..., Z=26. Enter any name and get the total alphabetical score — with animated letter chips showing each value.
February 10, 2026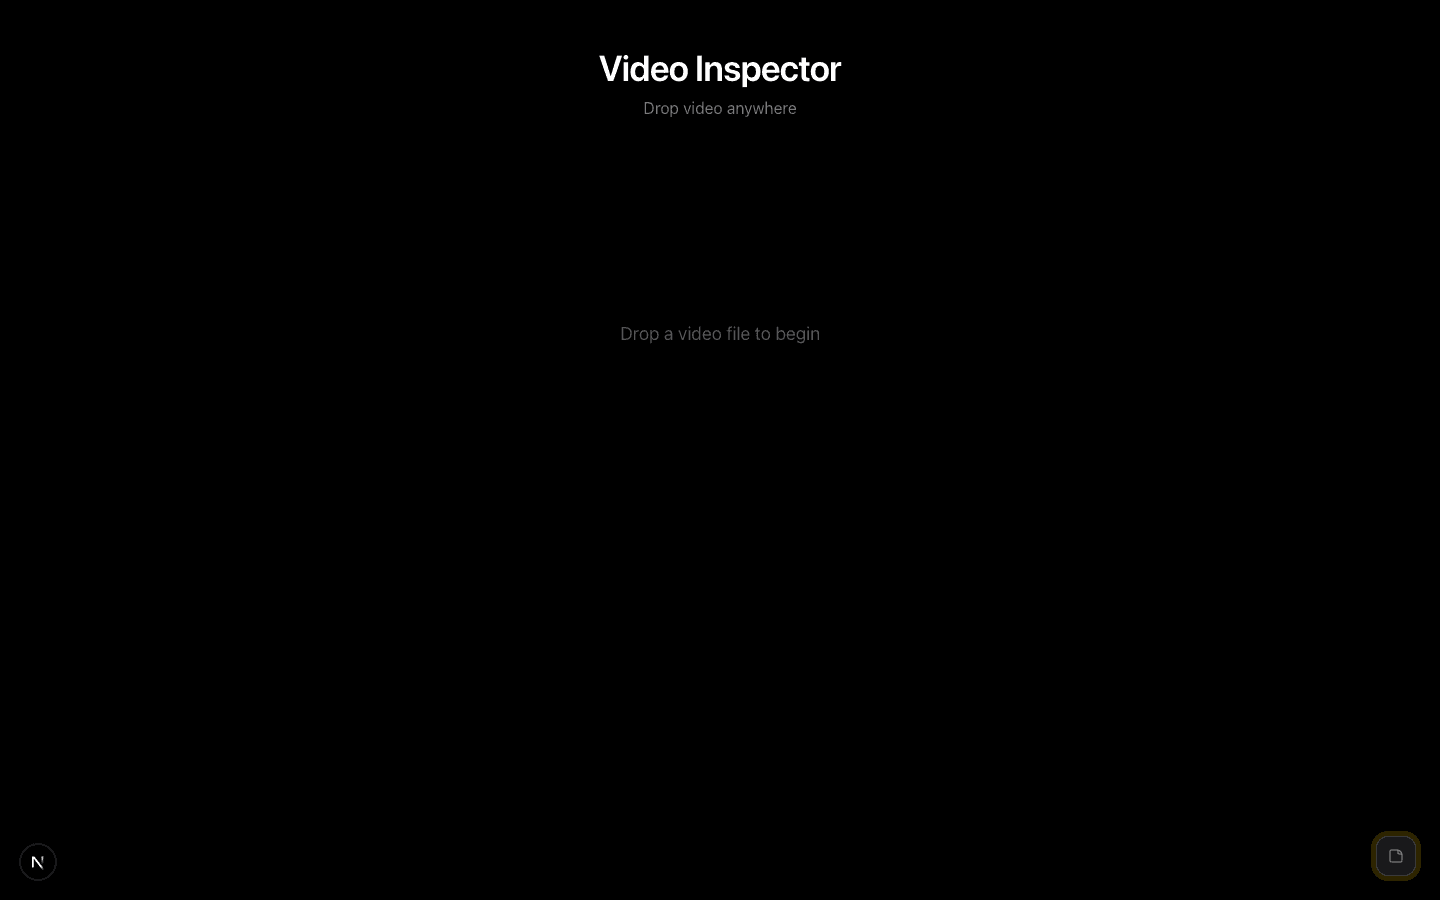
Drop a video file and instantly see codec, resolution, duration, file size, and modified date — plus a ready-to-run ffmpeg transcription command.
February 9, 2026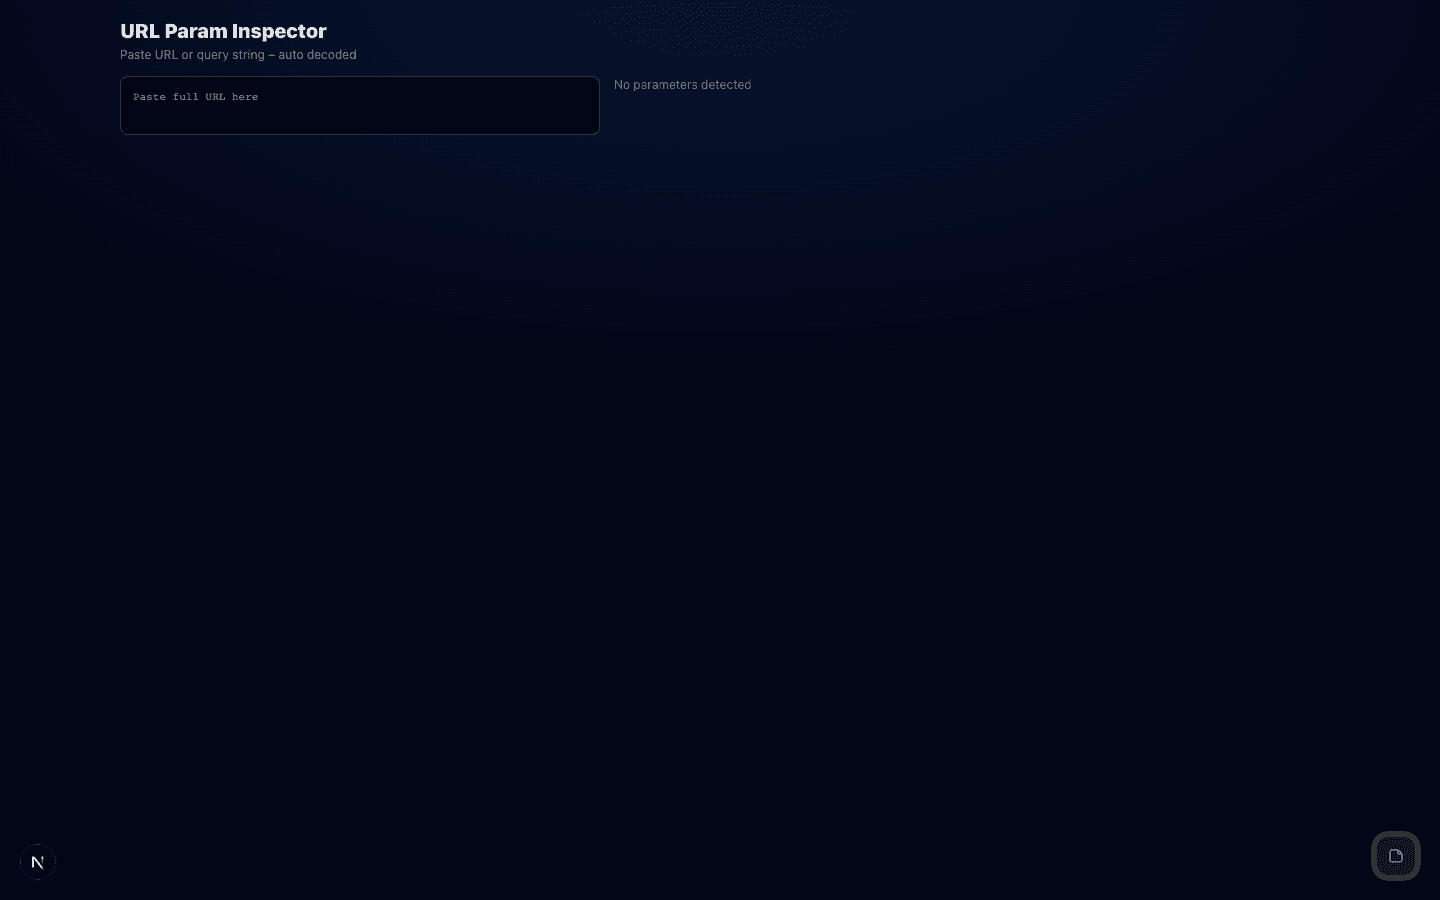
Paste any URL or query string — every parameter renders as a labeled card with its decoded value. Copy individual values in one click.
February 8, 2026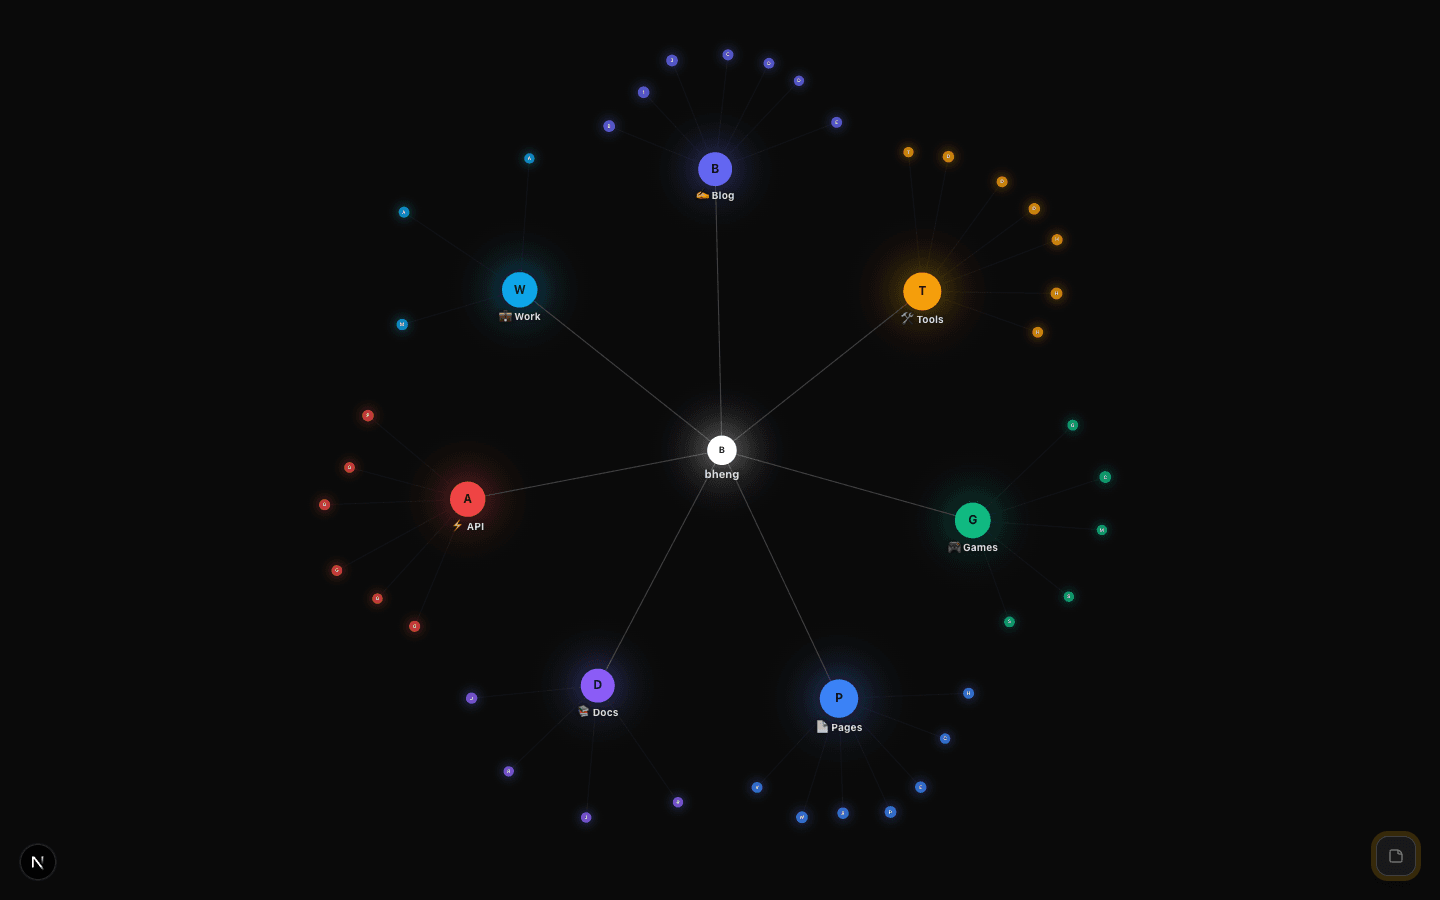
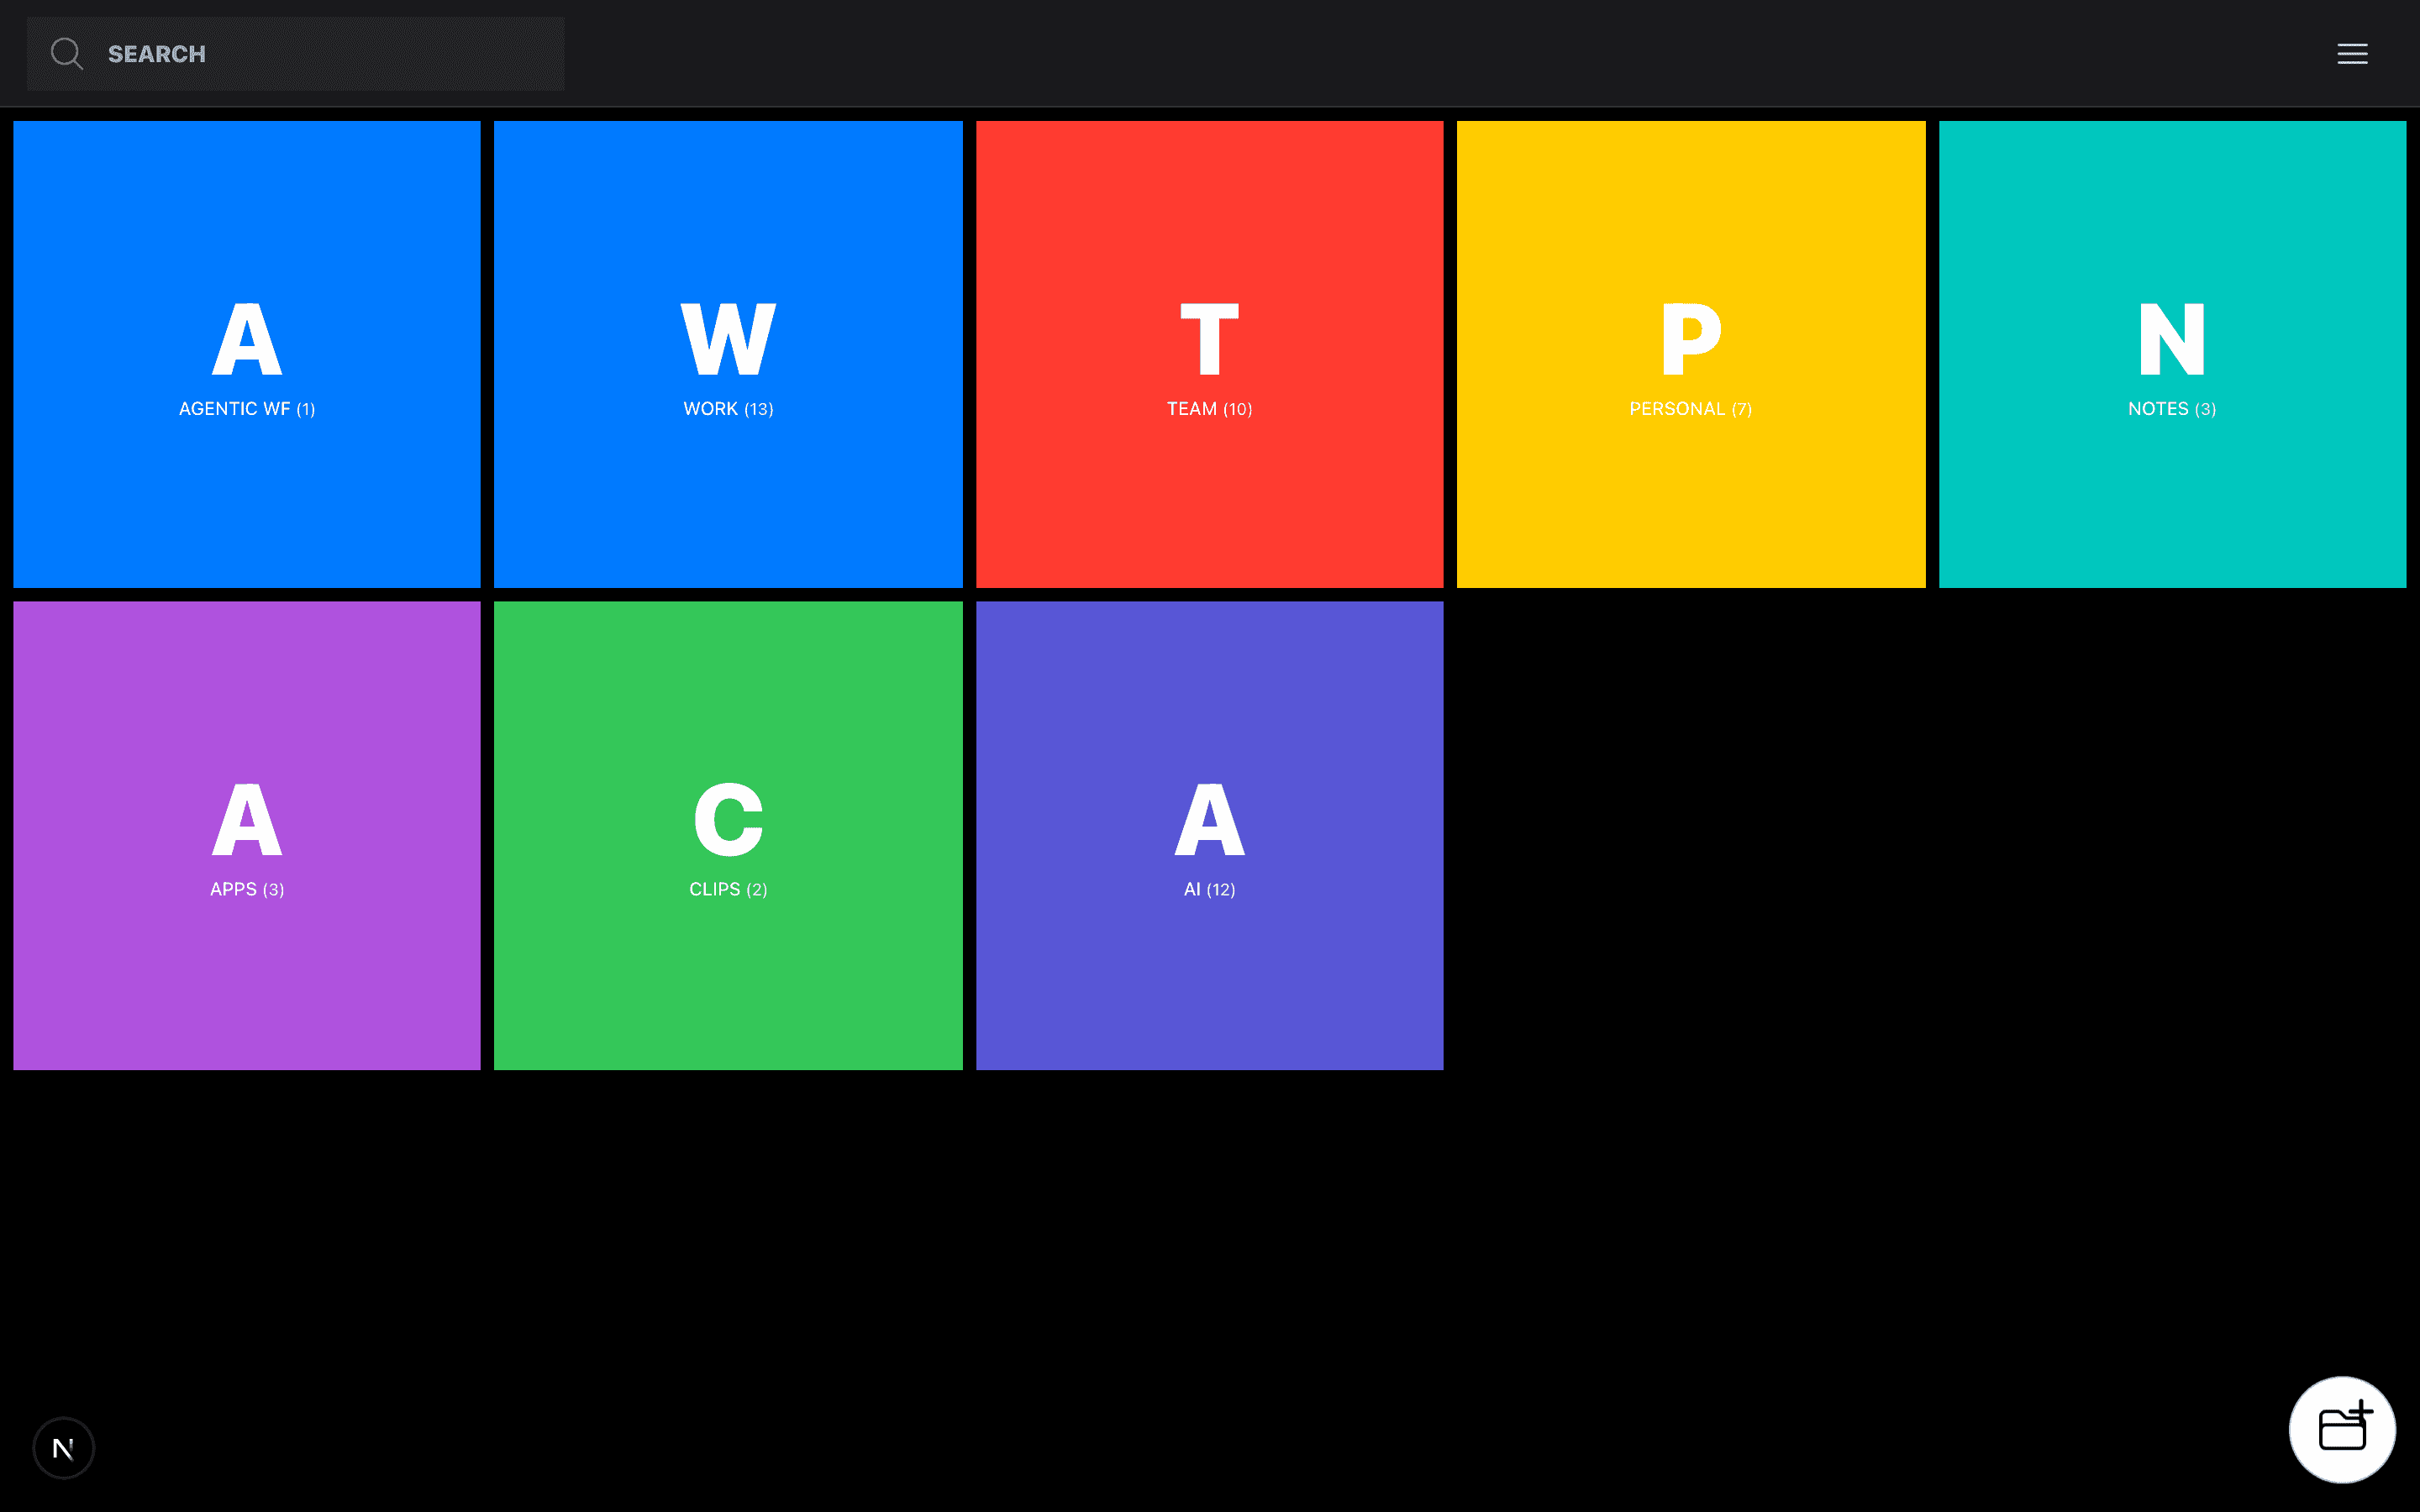
Every route on bheng.com in one view — blog posts, tools, games, API endpoints, and docs — organized by category with color-coded sections.
February 7, 2026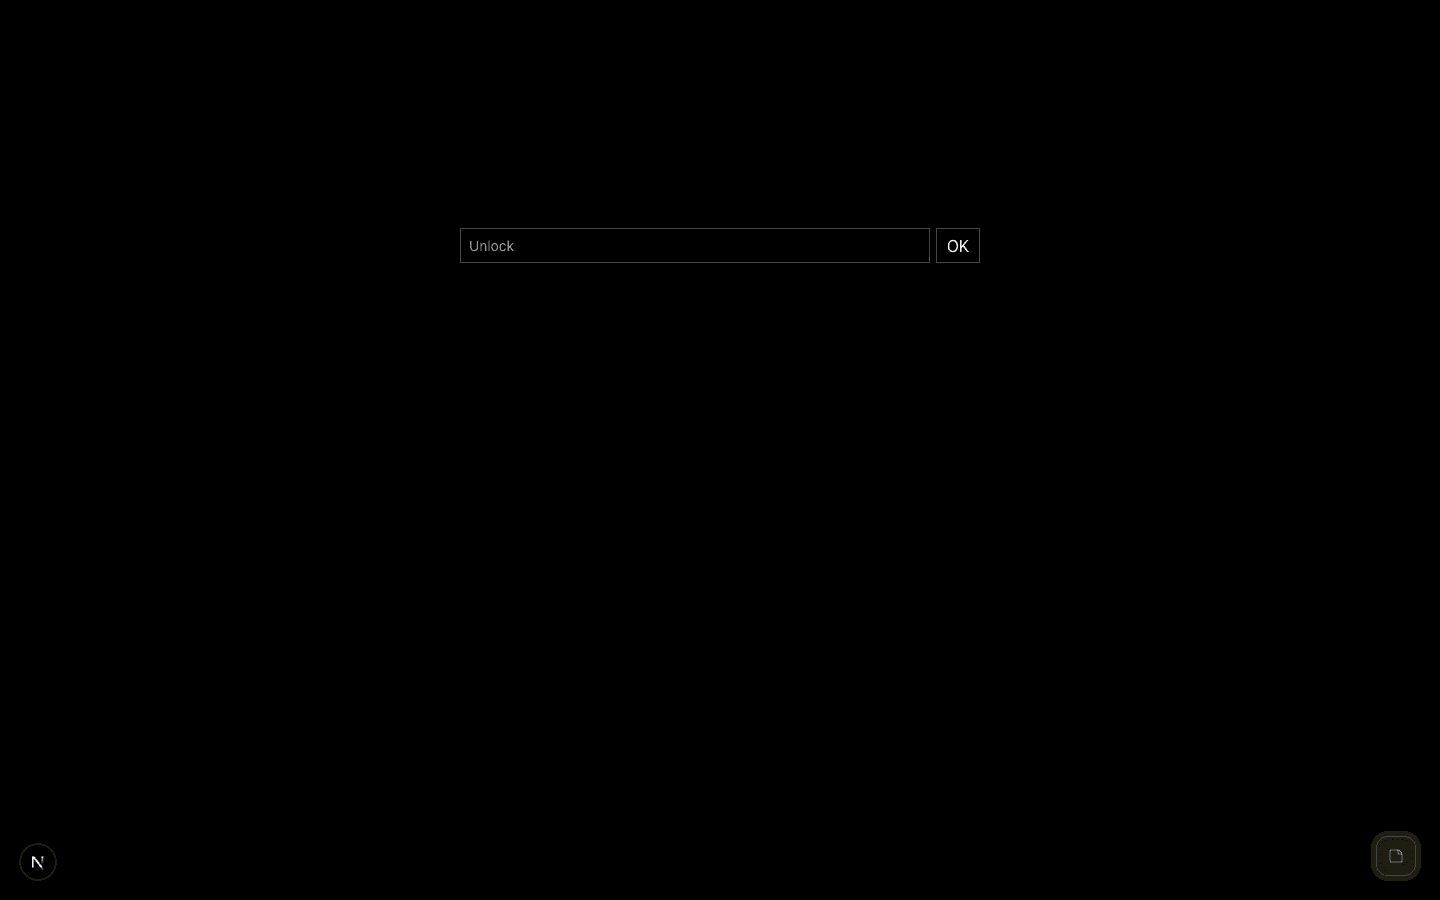
A password-locked list storage tool that auto-masks after 30 seconds of idle. Honeypot fields block password managers. Nothing leaves your browser.
February 5, 2026
Converts markdown sections into full-height colored bars with items. Resize the table, toggle light/dark, export as PNG.
February 3, 2026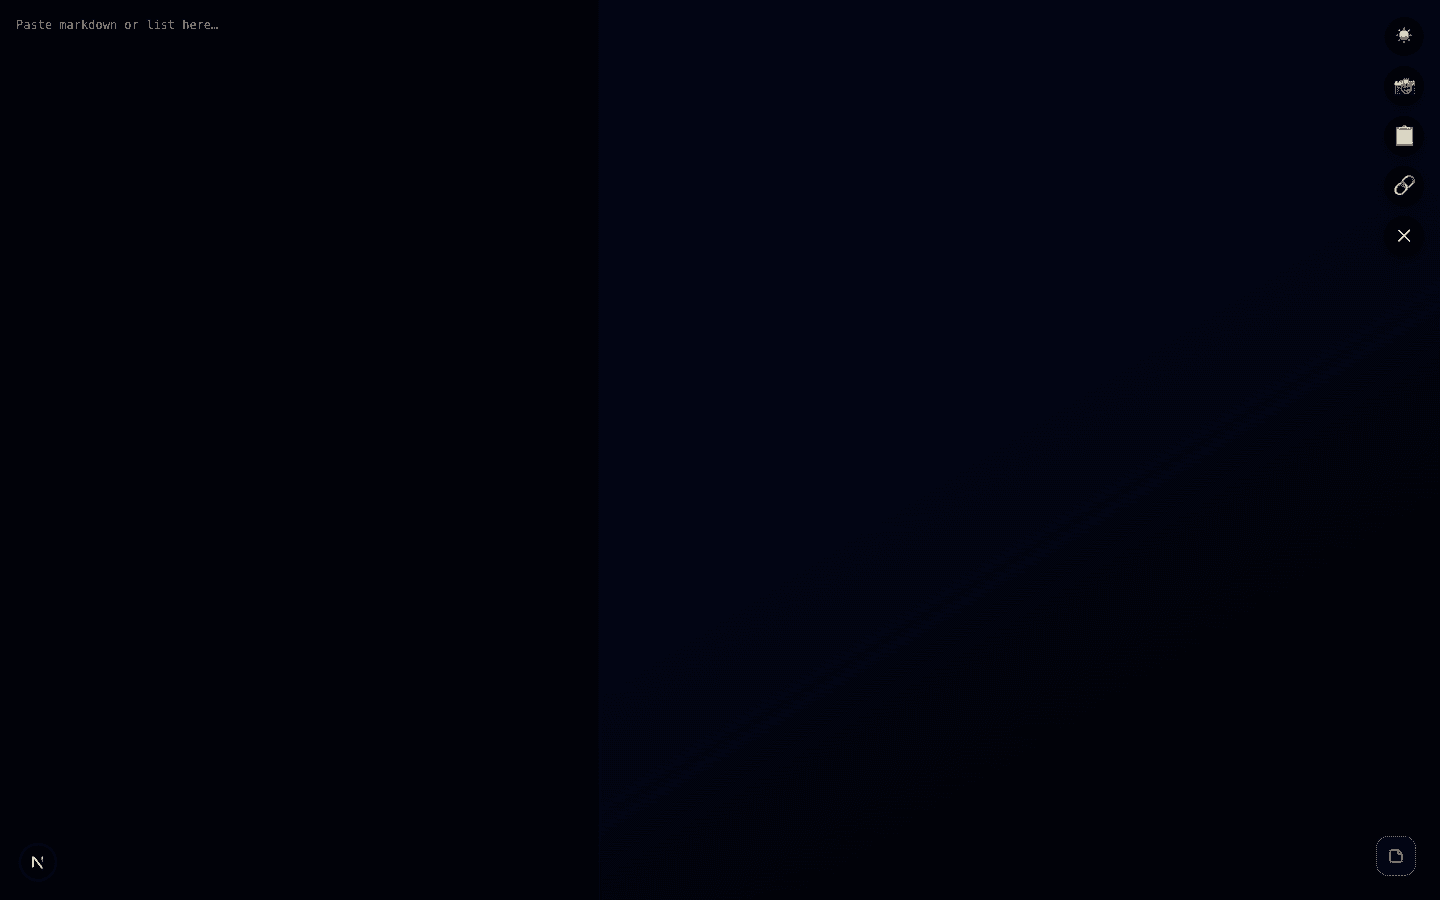
Paste markdown with sections and emoji headers — get a polished, color-coded table you can export as PNG. Built for scorecards, reviews, and structured comparisons.
February 1, 2026
Pick an icon from Heroicons or load a custom SVG, set a solid or gradient background, choose your size — download a production-ready PNG in one click.
January 28, 2026
Scan your local network and see every connected device — IP, hostname, MAC address, and device type. Quick scan for speed, deep scan for detail.
January 25, 2026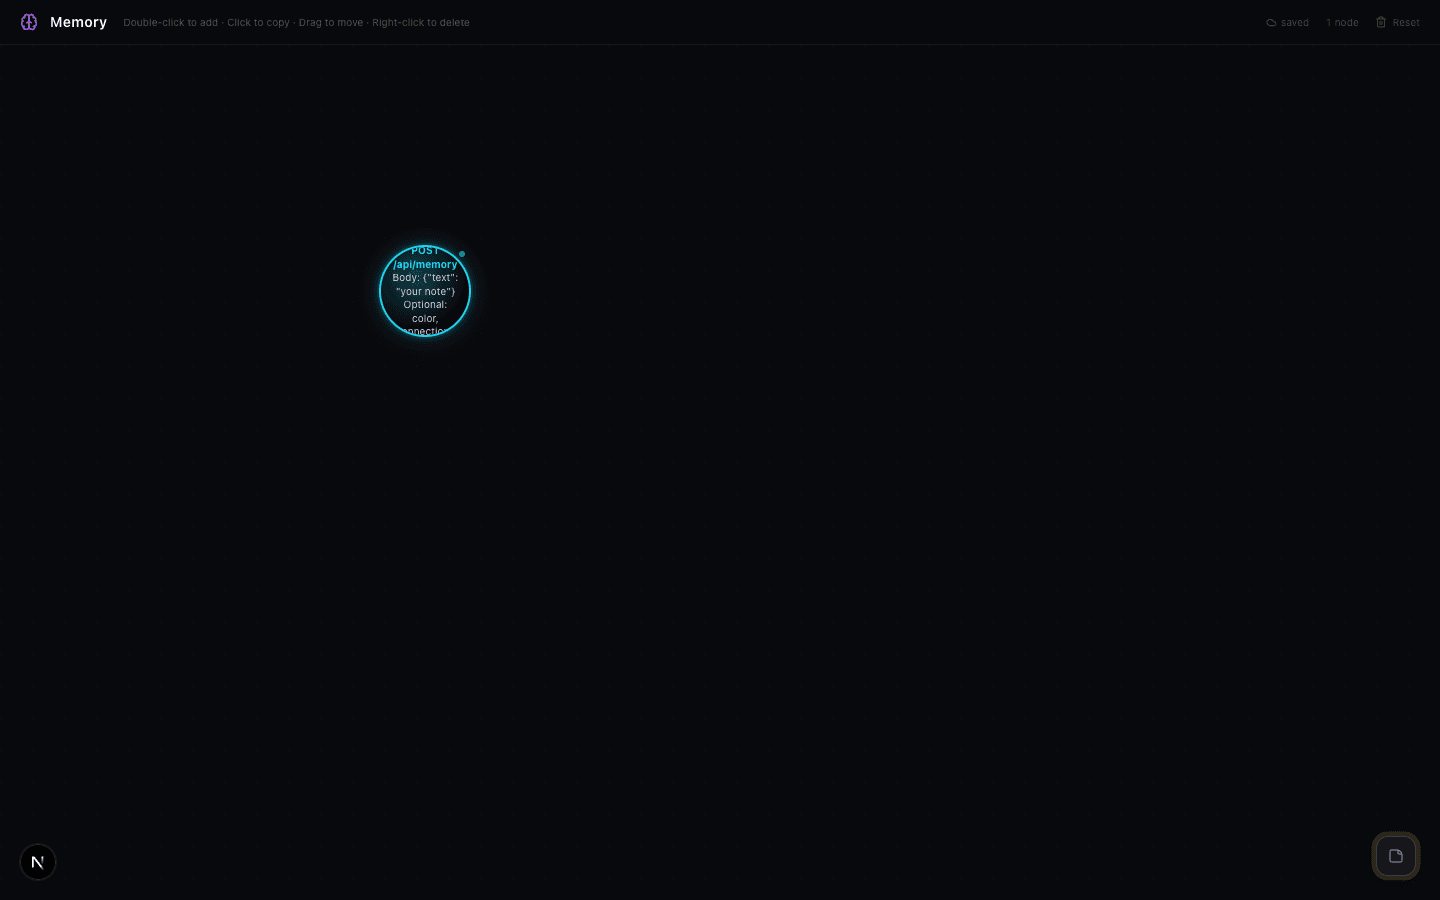
A spatial note-taking canvas where ideas are nodes and connections are edges. Double-click to create, drag to arrange, right-click to delete. Auto-saves to the cloud.
January 22, 2026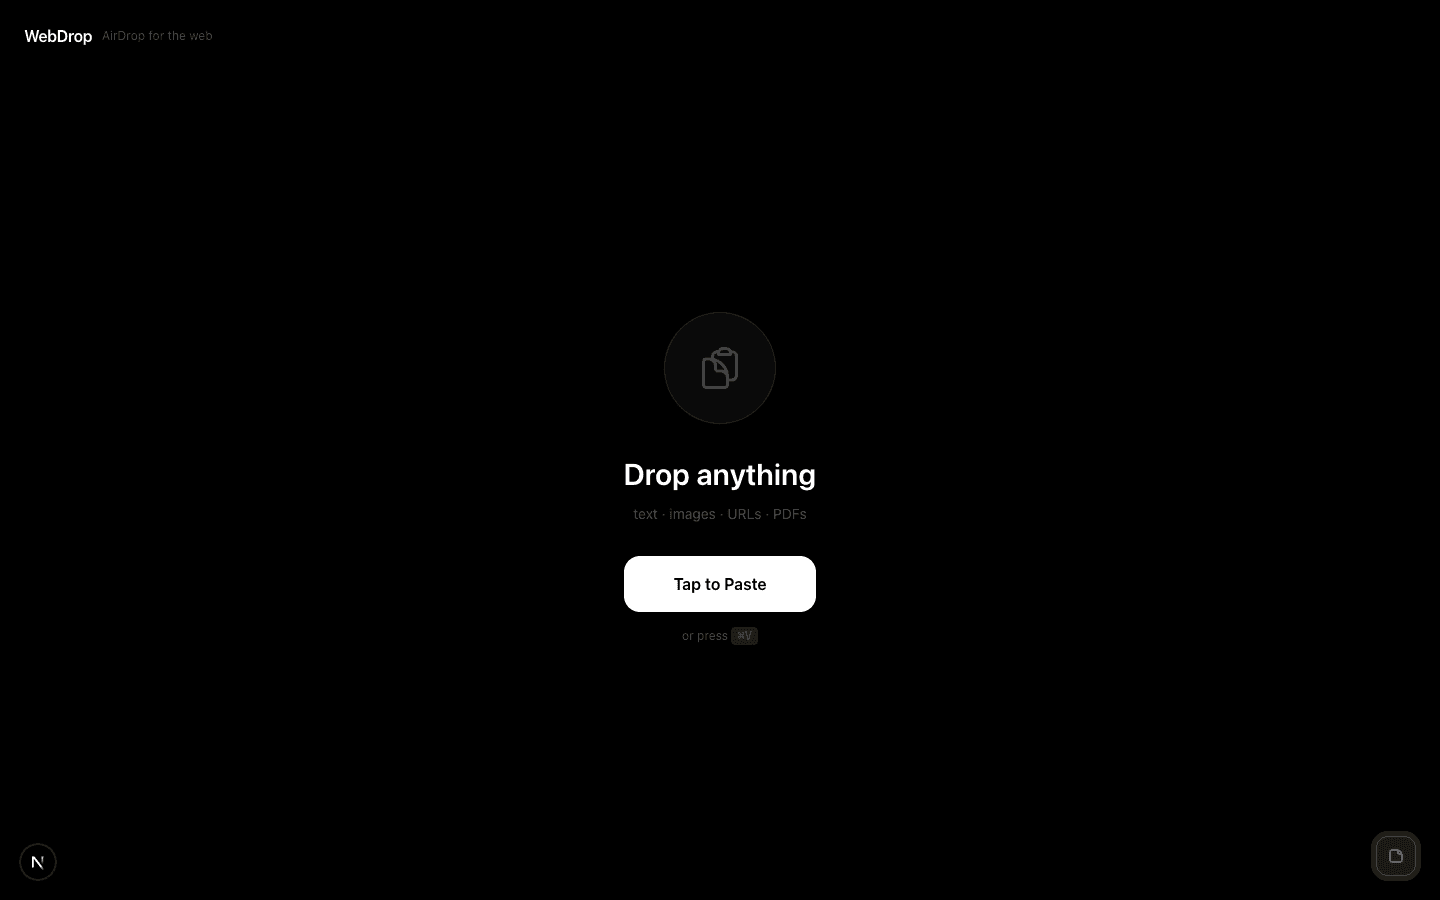
Paste text, images, or files — get a shareable link and QR code instantly. The sender knows the moment the receiver opens it. No account, no app install.
January 20, 2026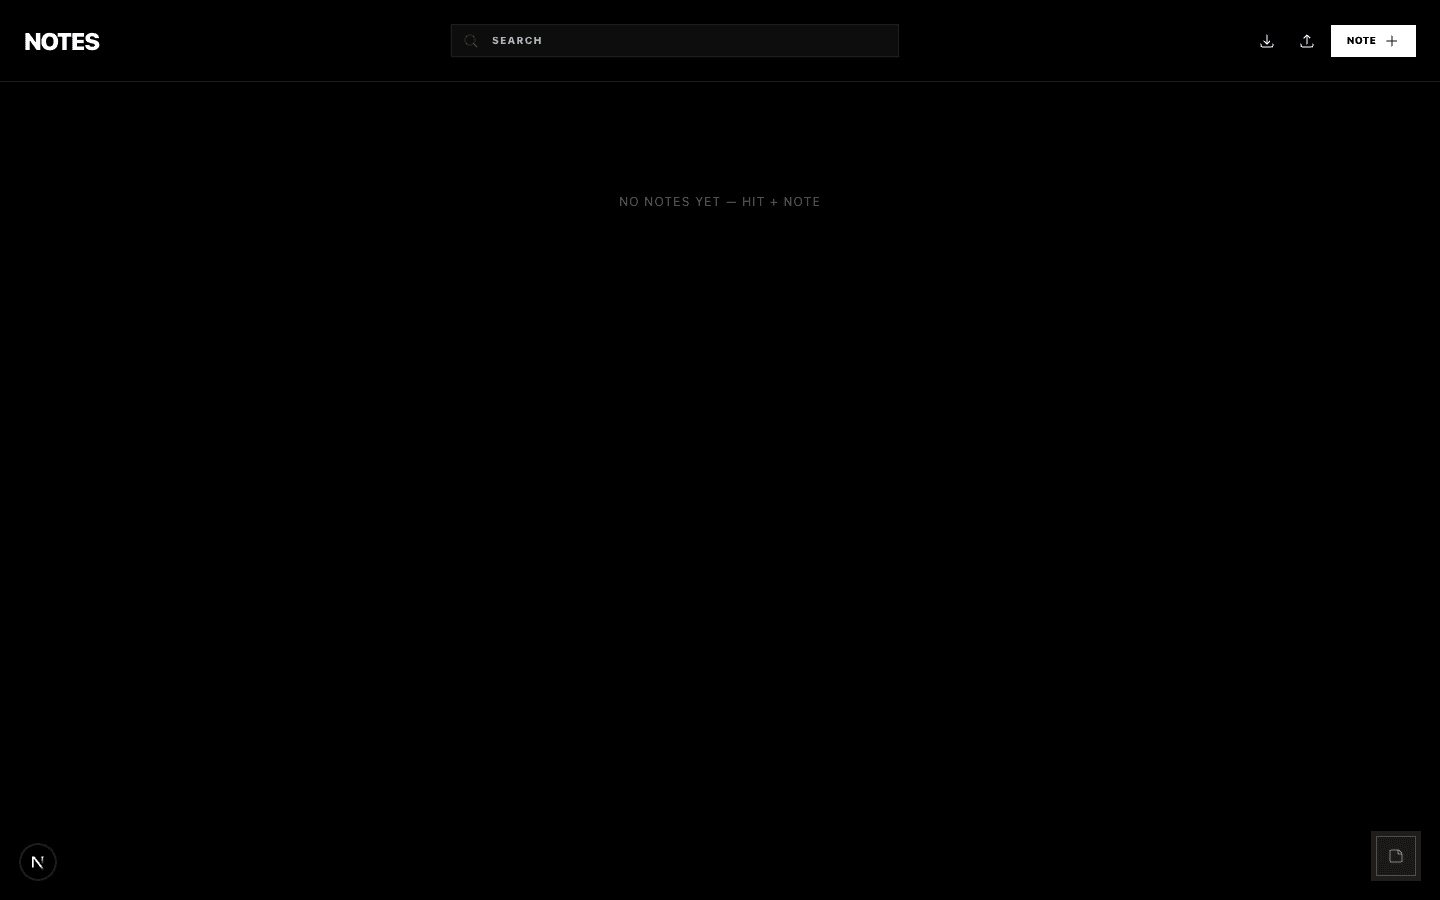
A keyboard-first note app that lives in your browser. Grid view, full search, JSON export, color themes, and QR code sharing — no account required.
January 15, 2026
Type an indented outline, get an interactive flowchart. Xmind converts plain text hierarchy into a draggable, zoomable node graph — no drag-and-drop required.
January 10, 2026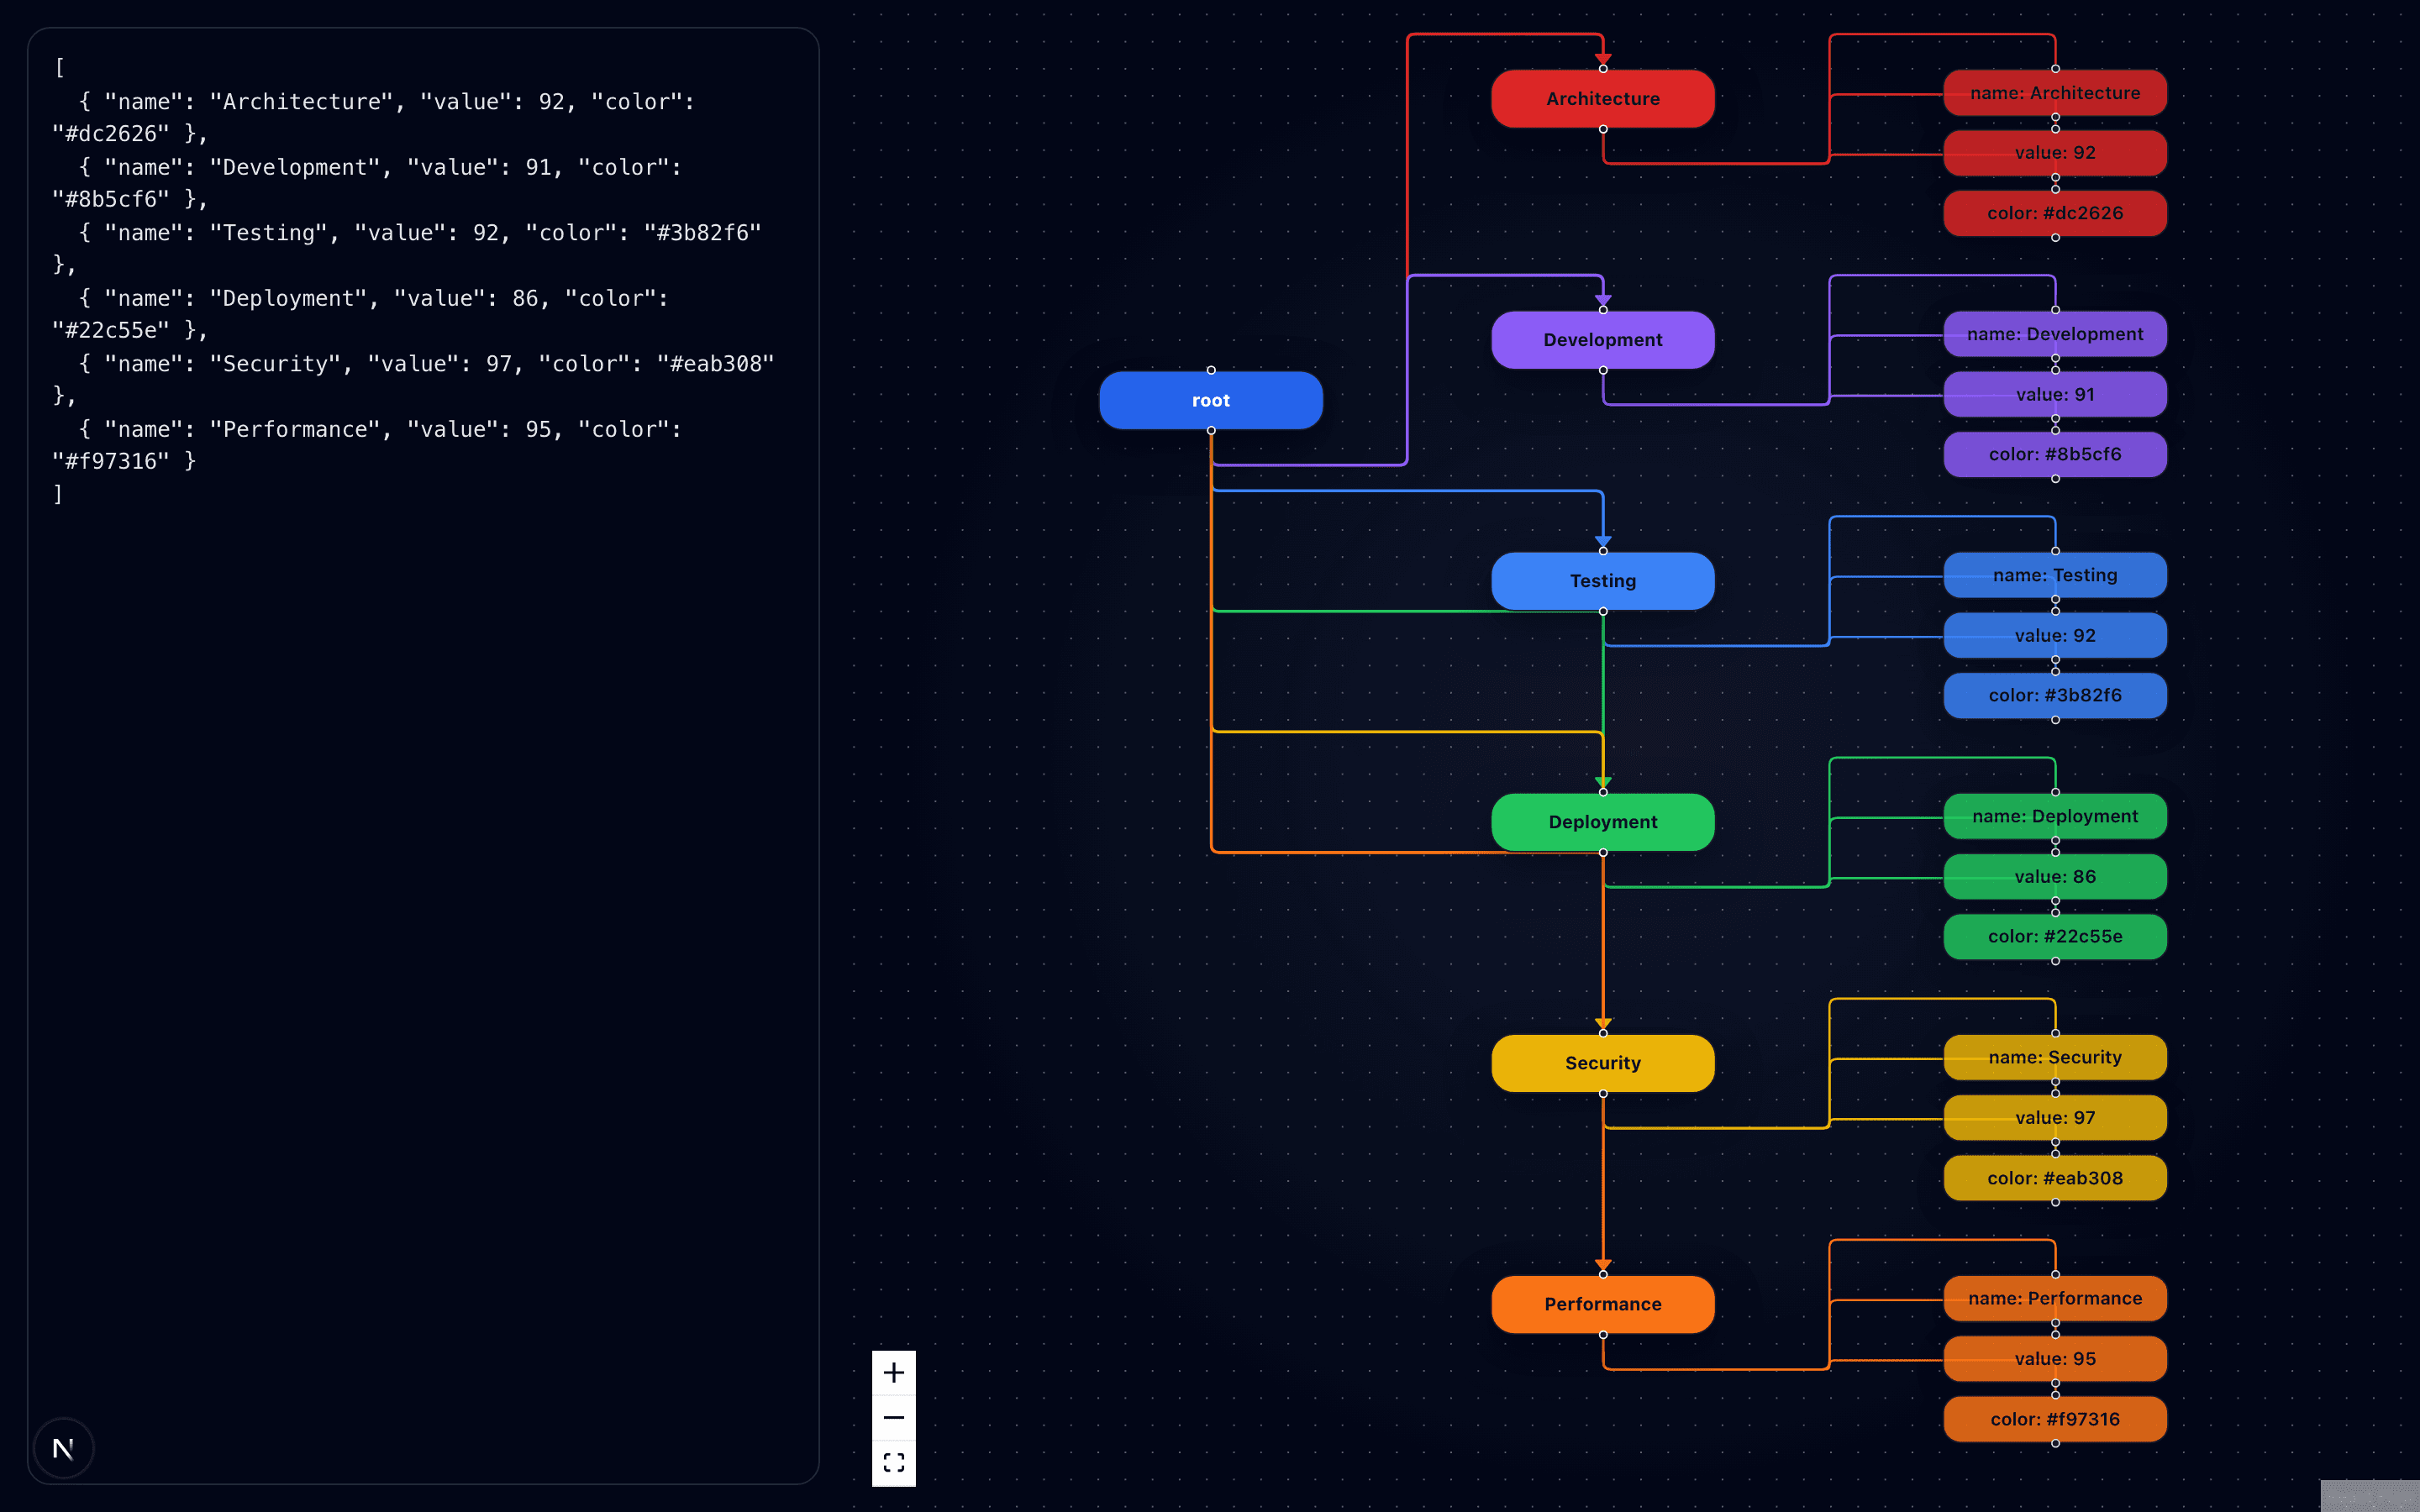
Three generations of a JSON visualizer — each one rendering your data as an interactive node graph you can explore, zoom, and pan.
September 15, 2025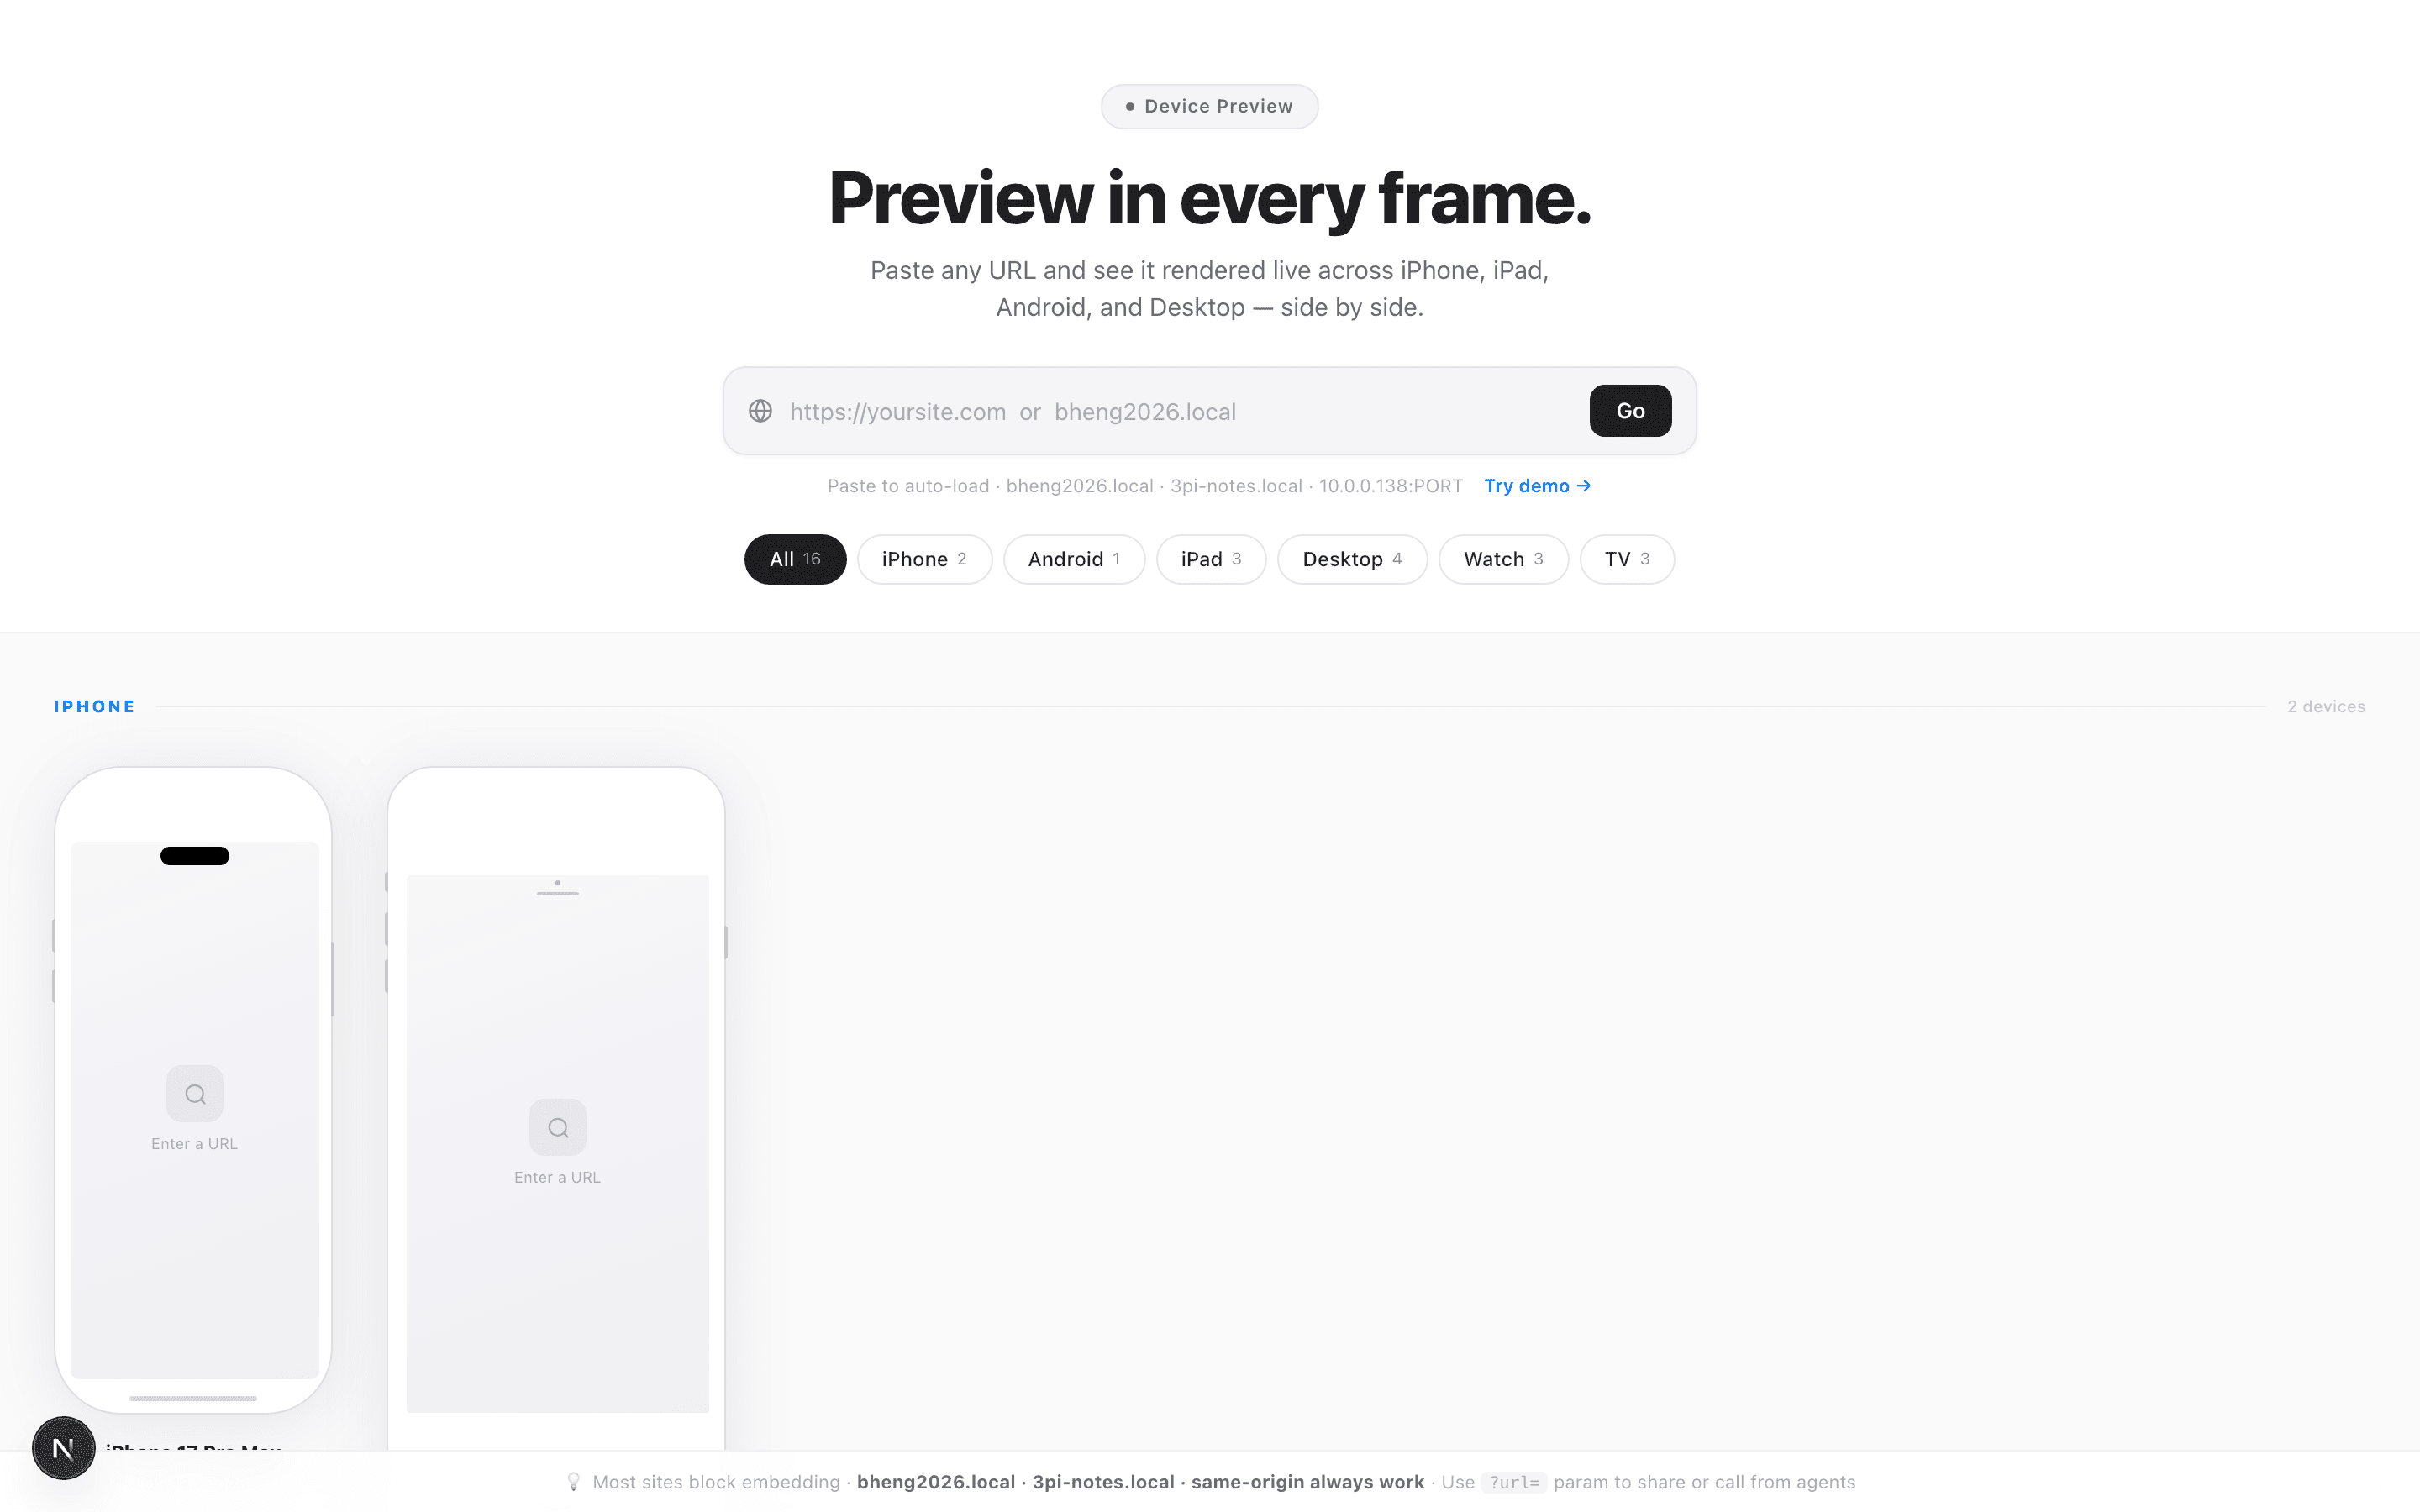
Drop a screenshot, pick a device, get a perfect device-framed mockup. iPhone, iPad, Android, Mac, Apple Watch, and Apple TV — all rendered in the browser.
August 28, 2025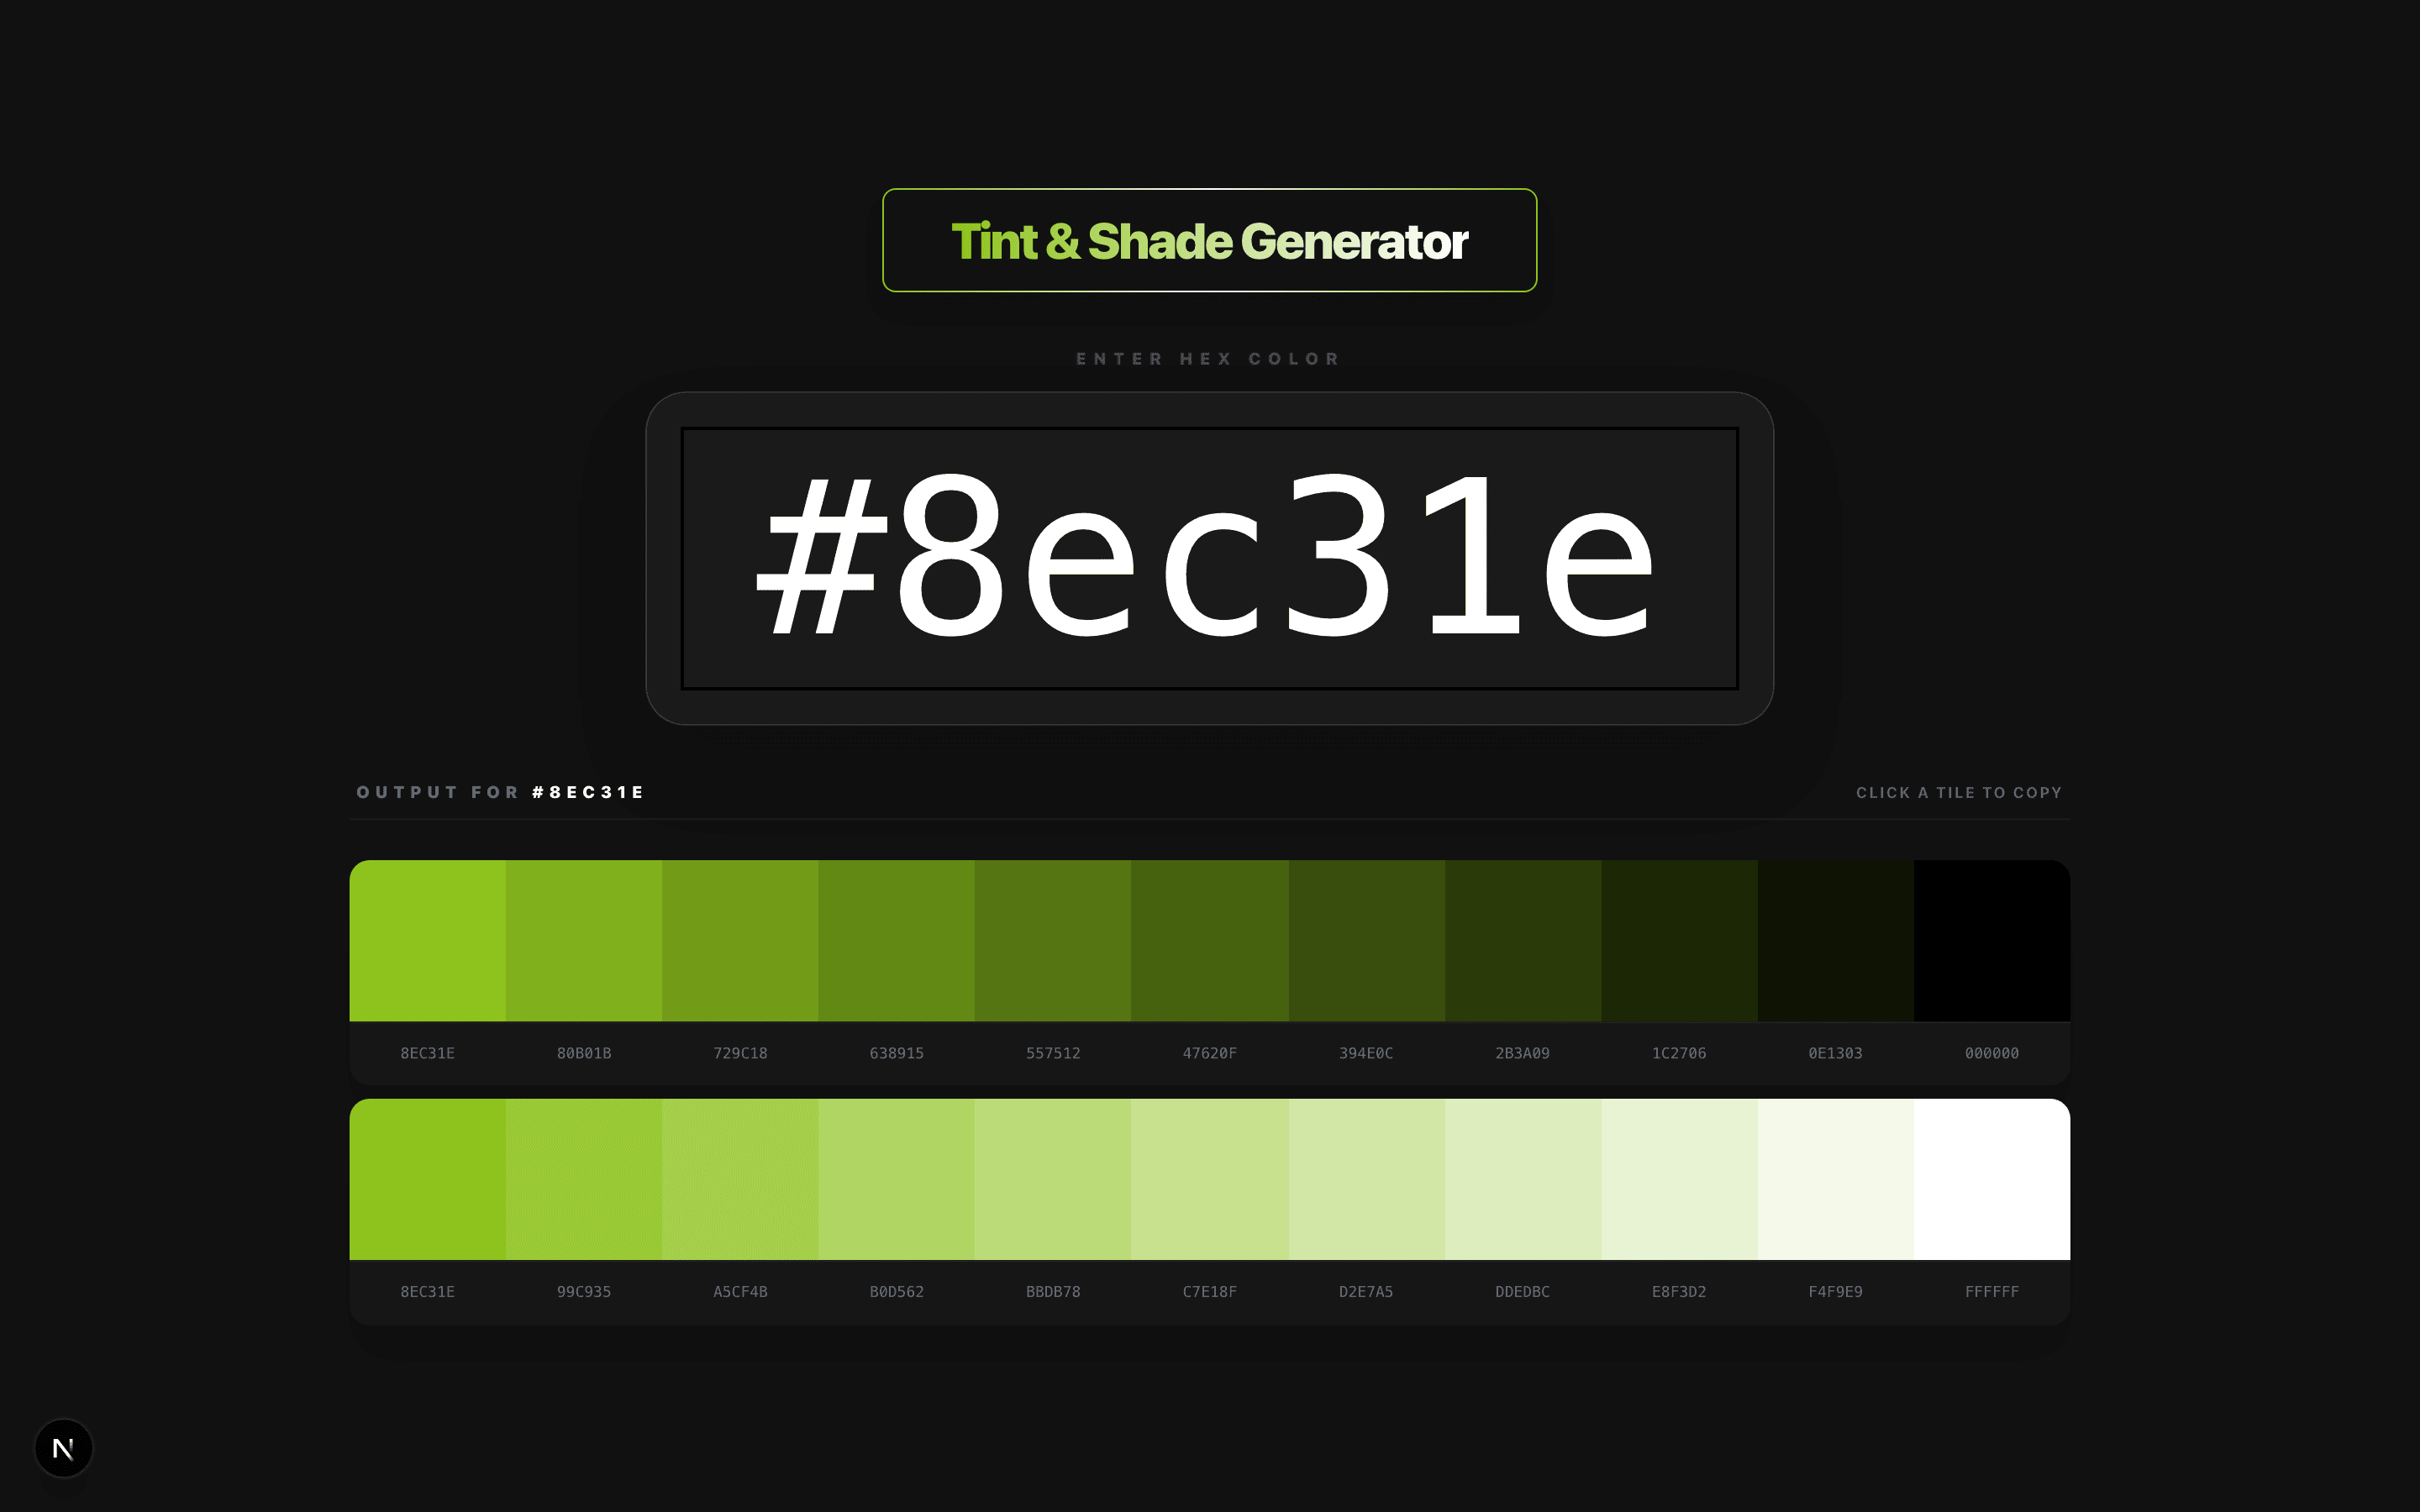
Enter any hex color and instantly get 11 tints and 11 shades — click any swatch to copy the value, perfect for building CSS design systems.
August 1, 2025
A rich data visualization dashboard using Recharts — bar charts, pie charts, area charts, scatter plots, and more, all driven by a single config JSON.
June 20, 2025