JSON Graph Visualizer
Bunlong Heng
September 15, 2025
Debugging deeply nested JSON is painful in a text editor. I built three progressively better versions of a JSON-to-graph visualizer to explore what the best visualization actually looks like.
What it does
Paste any JSON into the editor. The tool parses it and renders every key-value pair as an interactive node graph using ReactFlow. You can zoom, pan, click nodes, and visually trace data relationships.
Three versions
json — The original
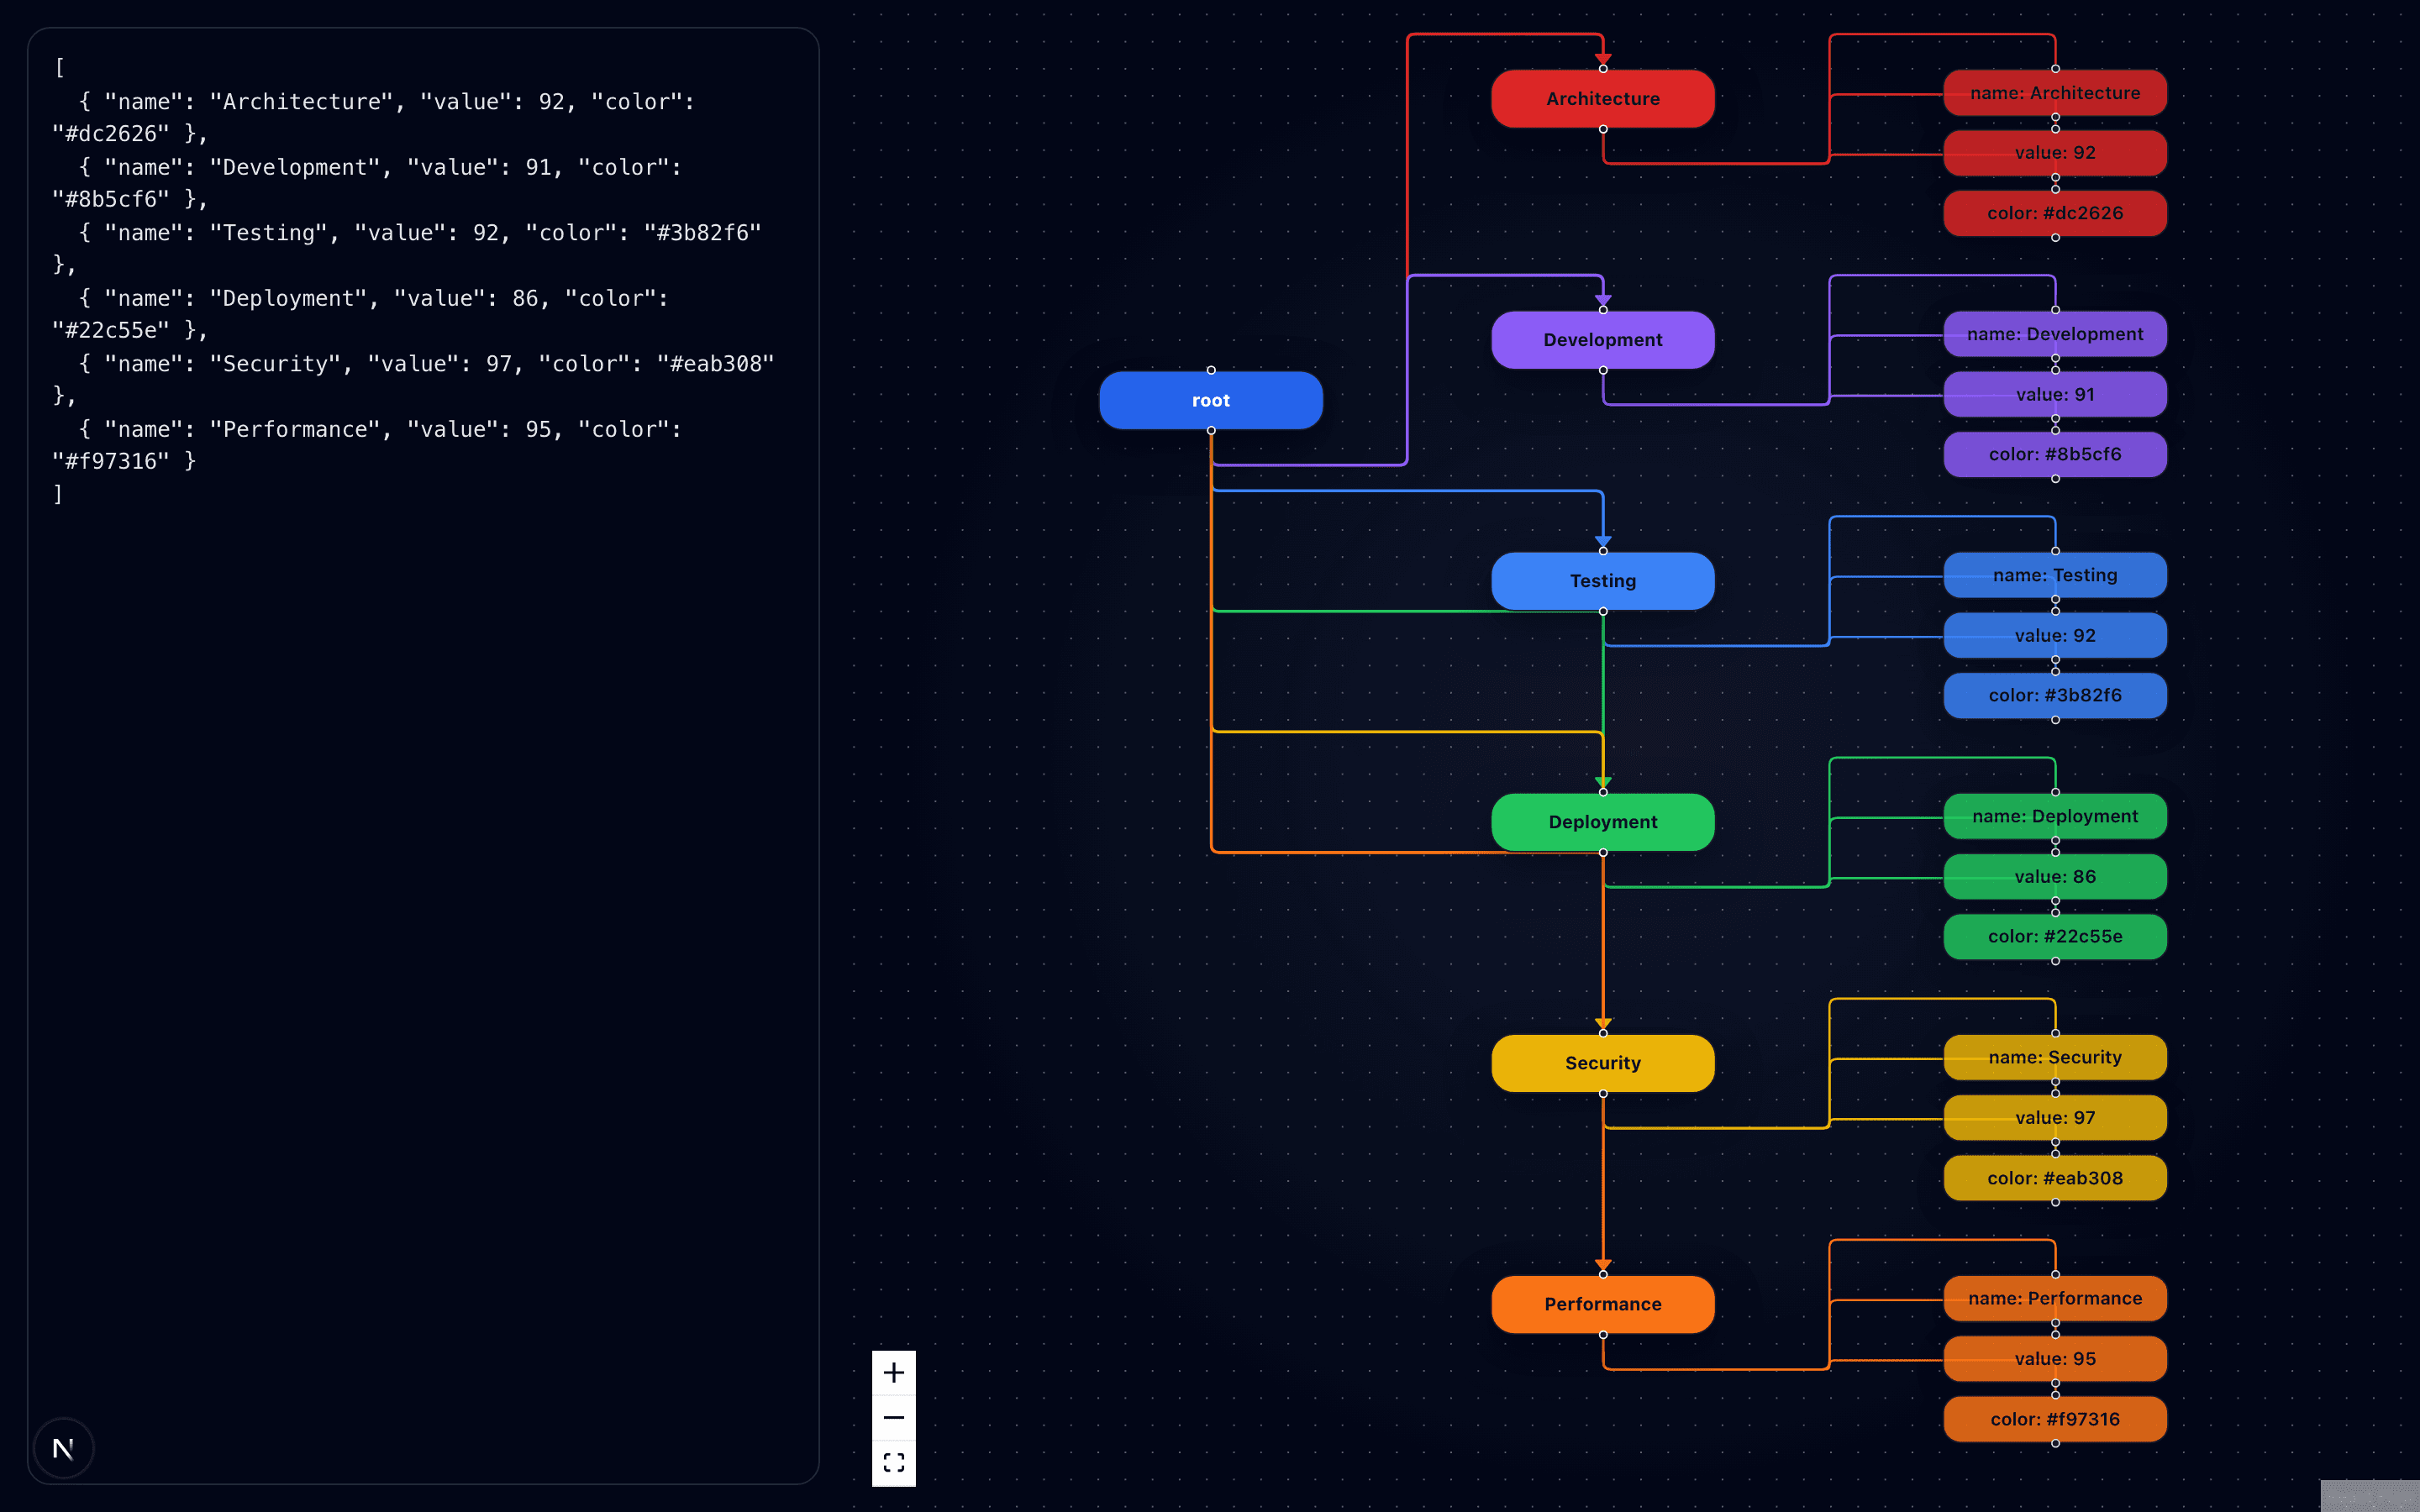
The first version renders arrays of objects as a star graph: a root node in the center, with each object as a child, and each key-value pair as a grandchild leaf. Clean and simple.
json2 — Hierarchical tree
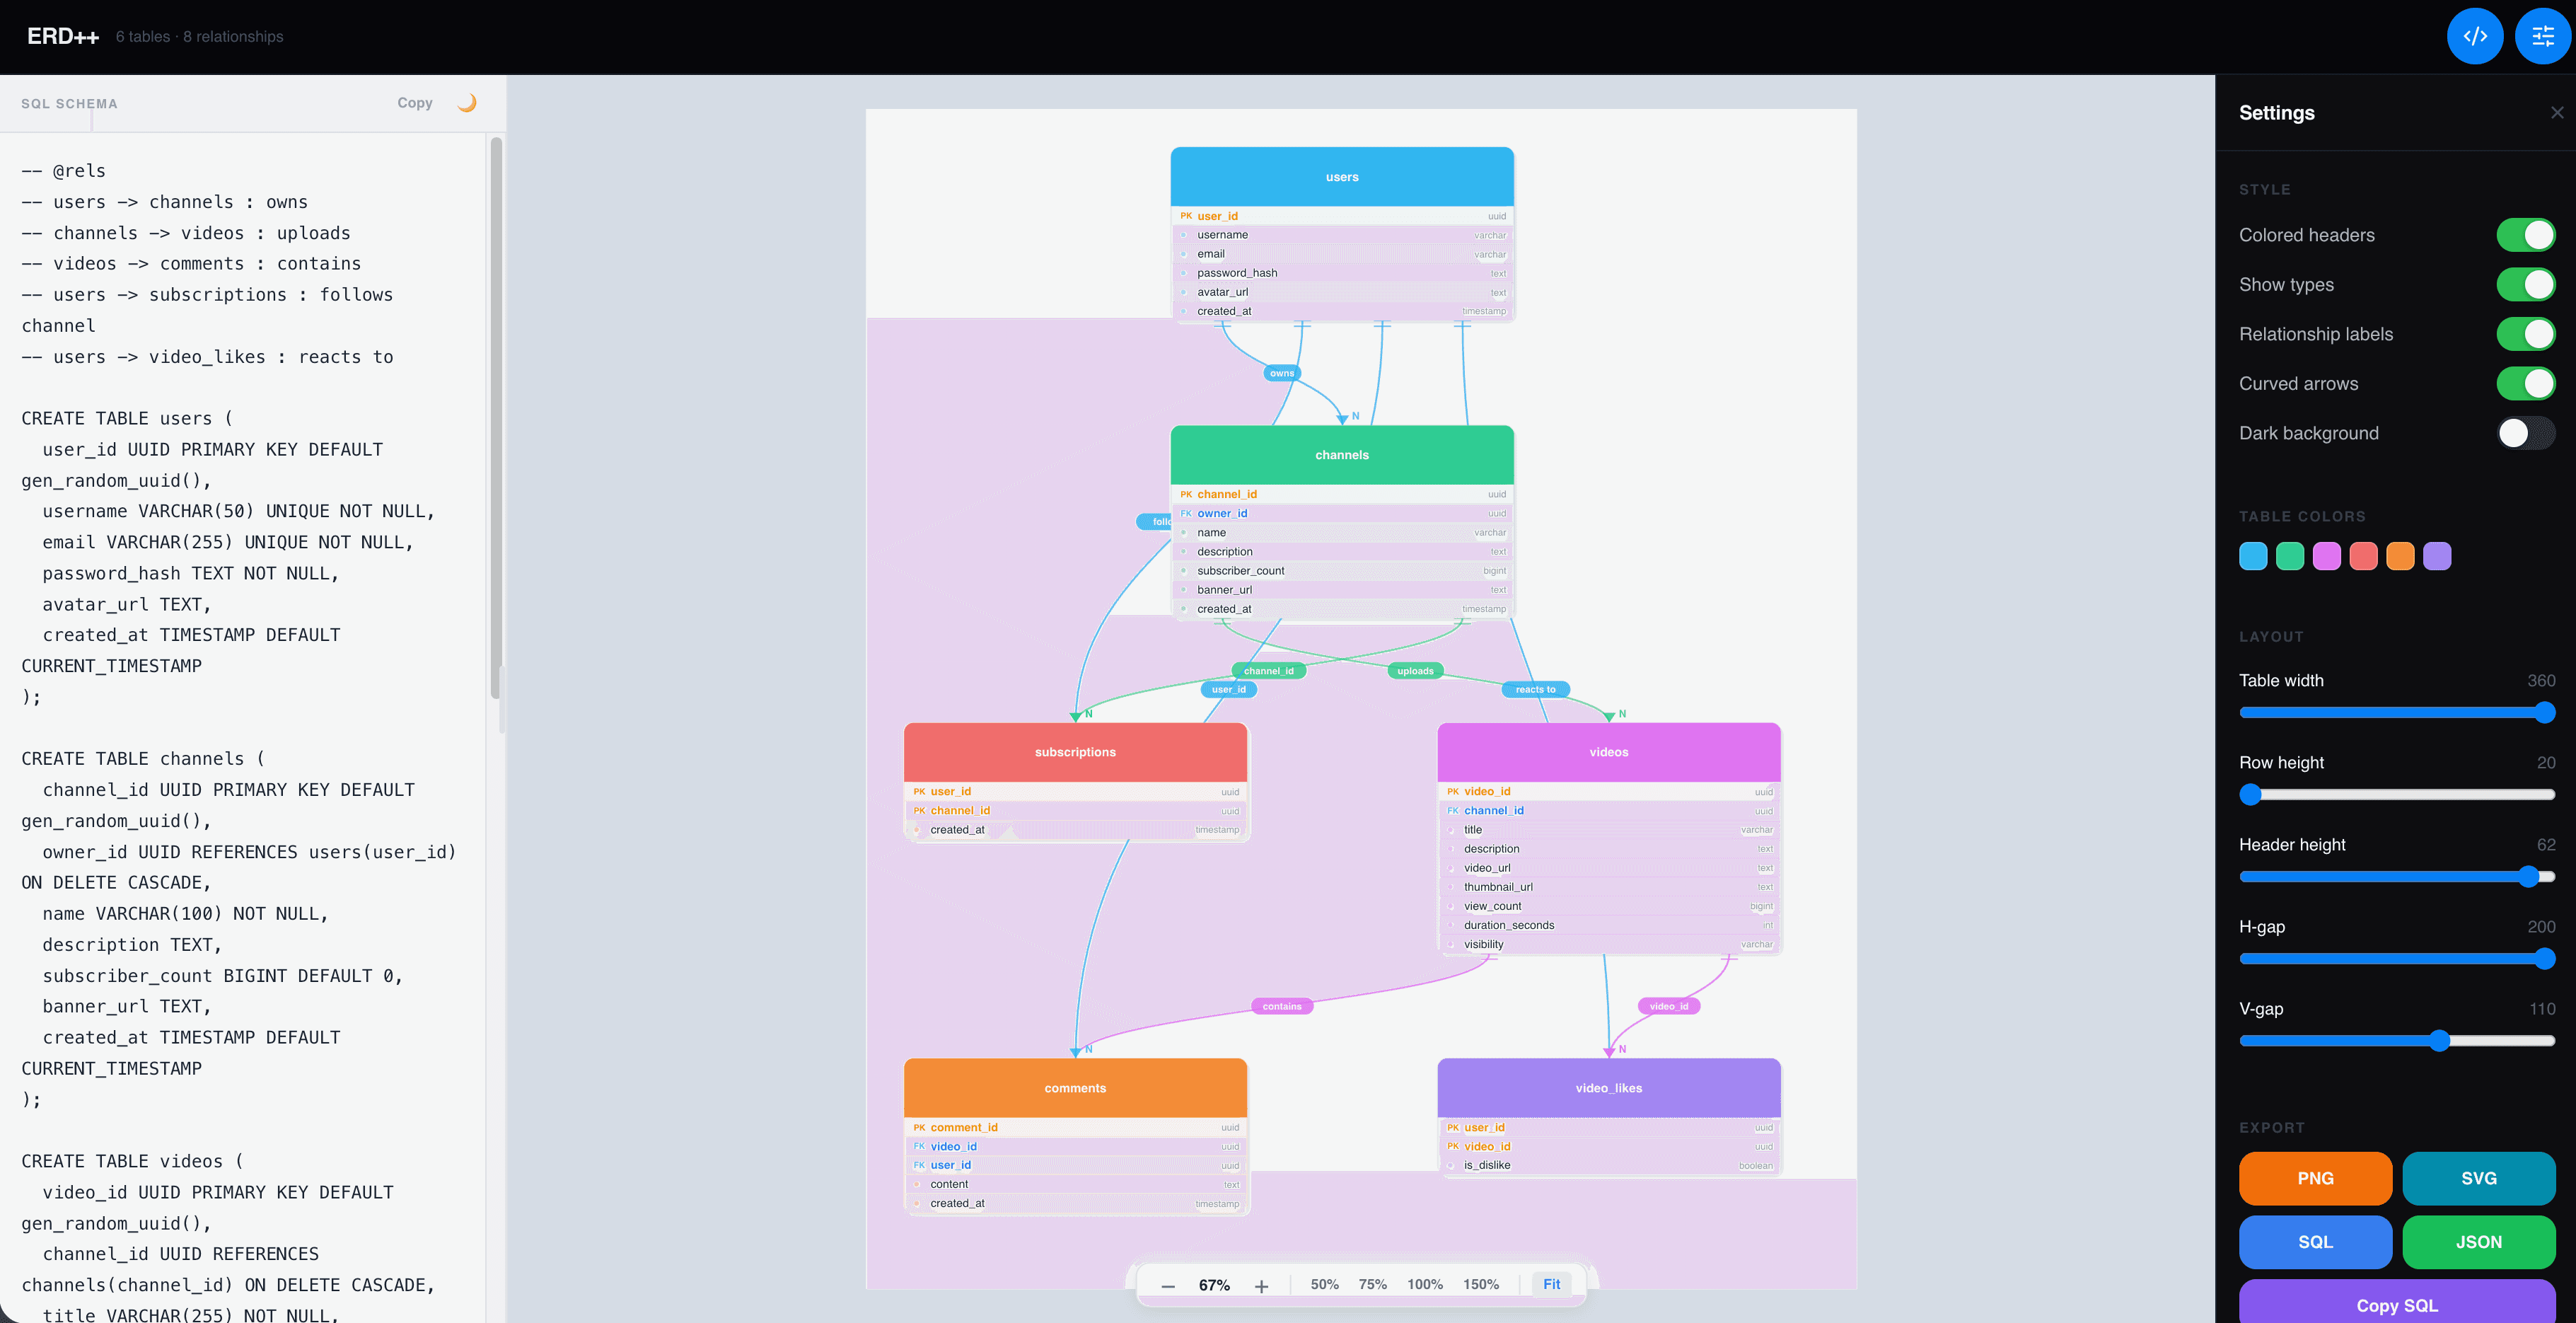
Improved layout algorithm with better edge routing. Objects nest properly as subtrees, and the layout adapts to depth.
json3 — Full recursive tree
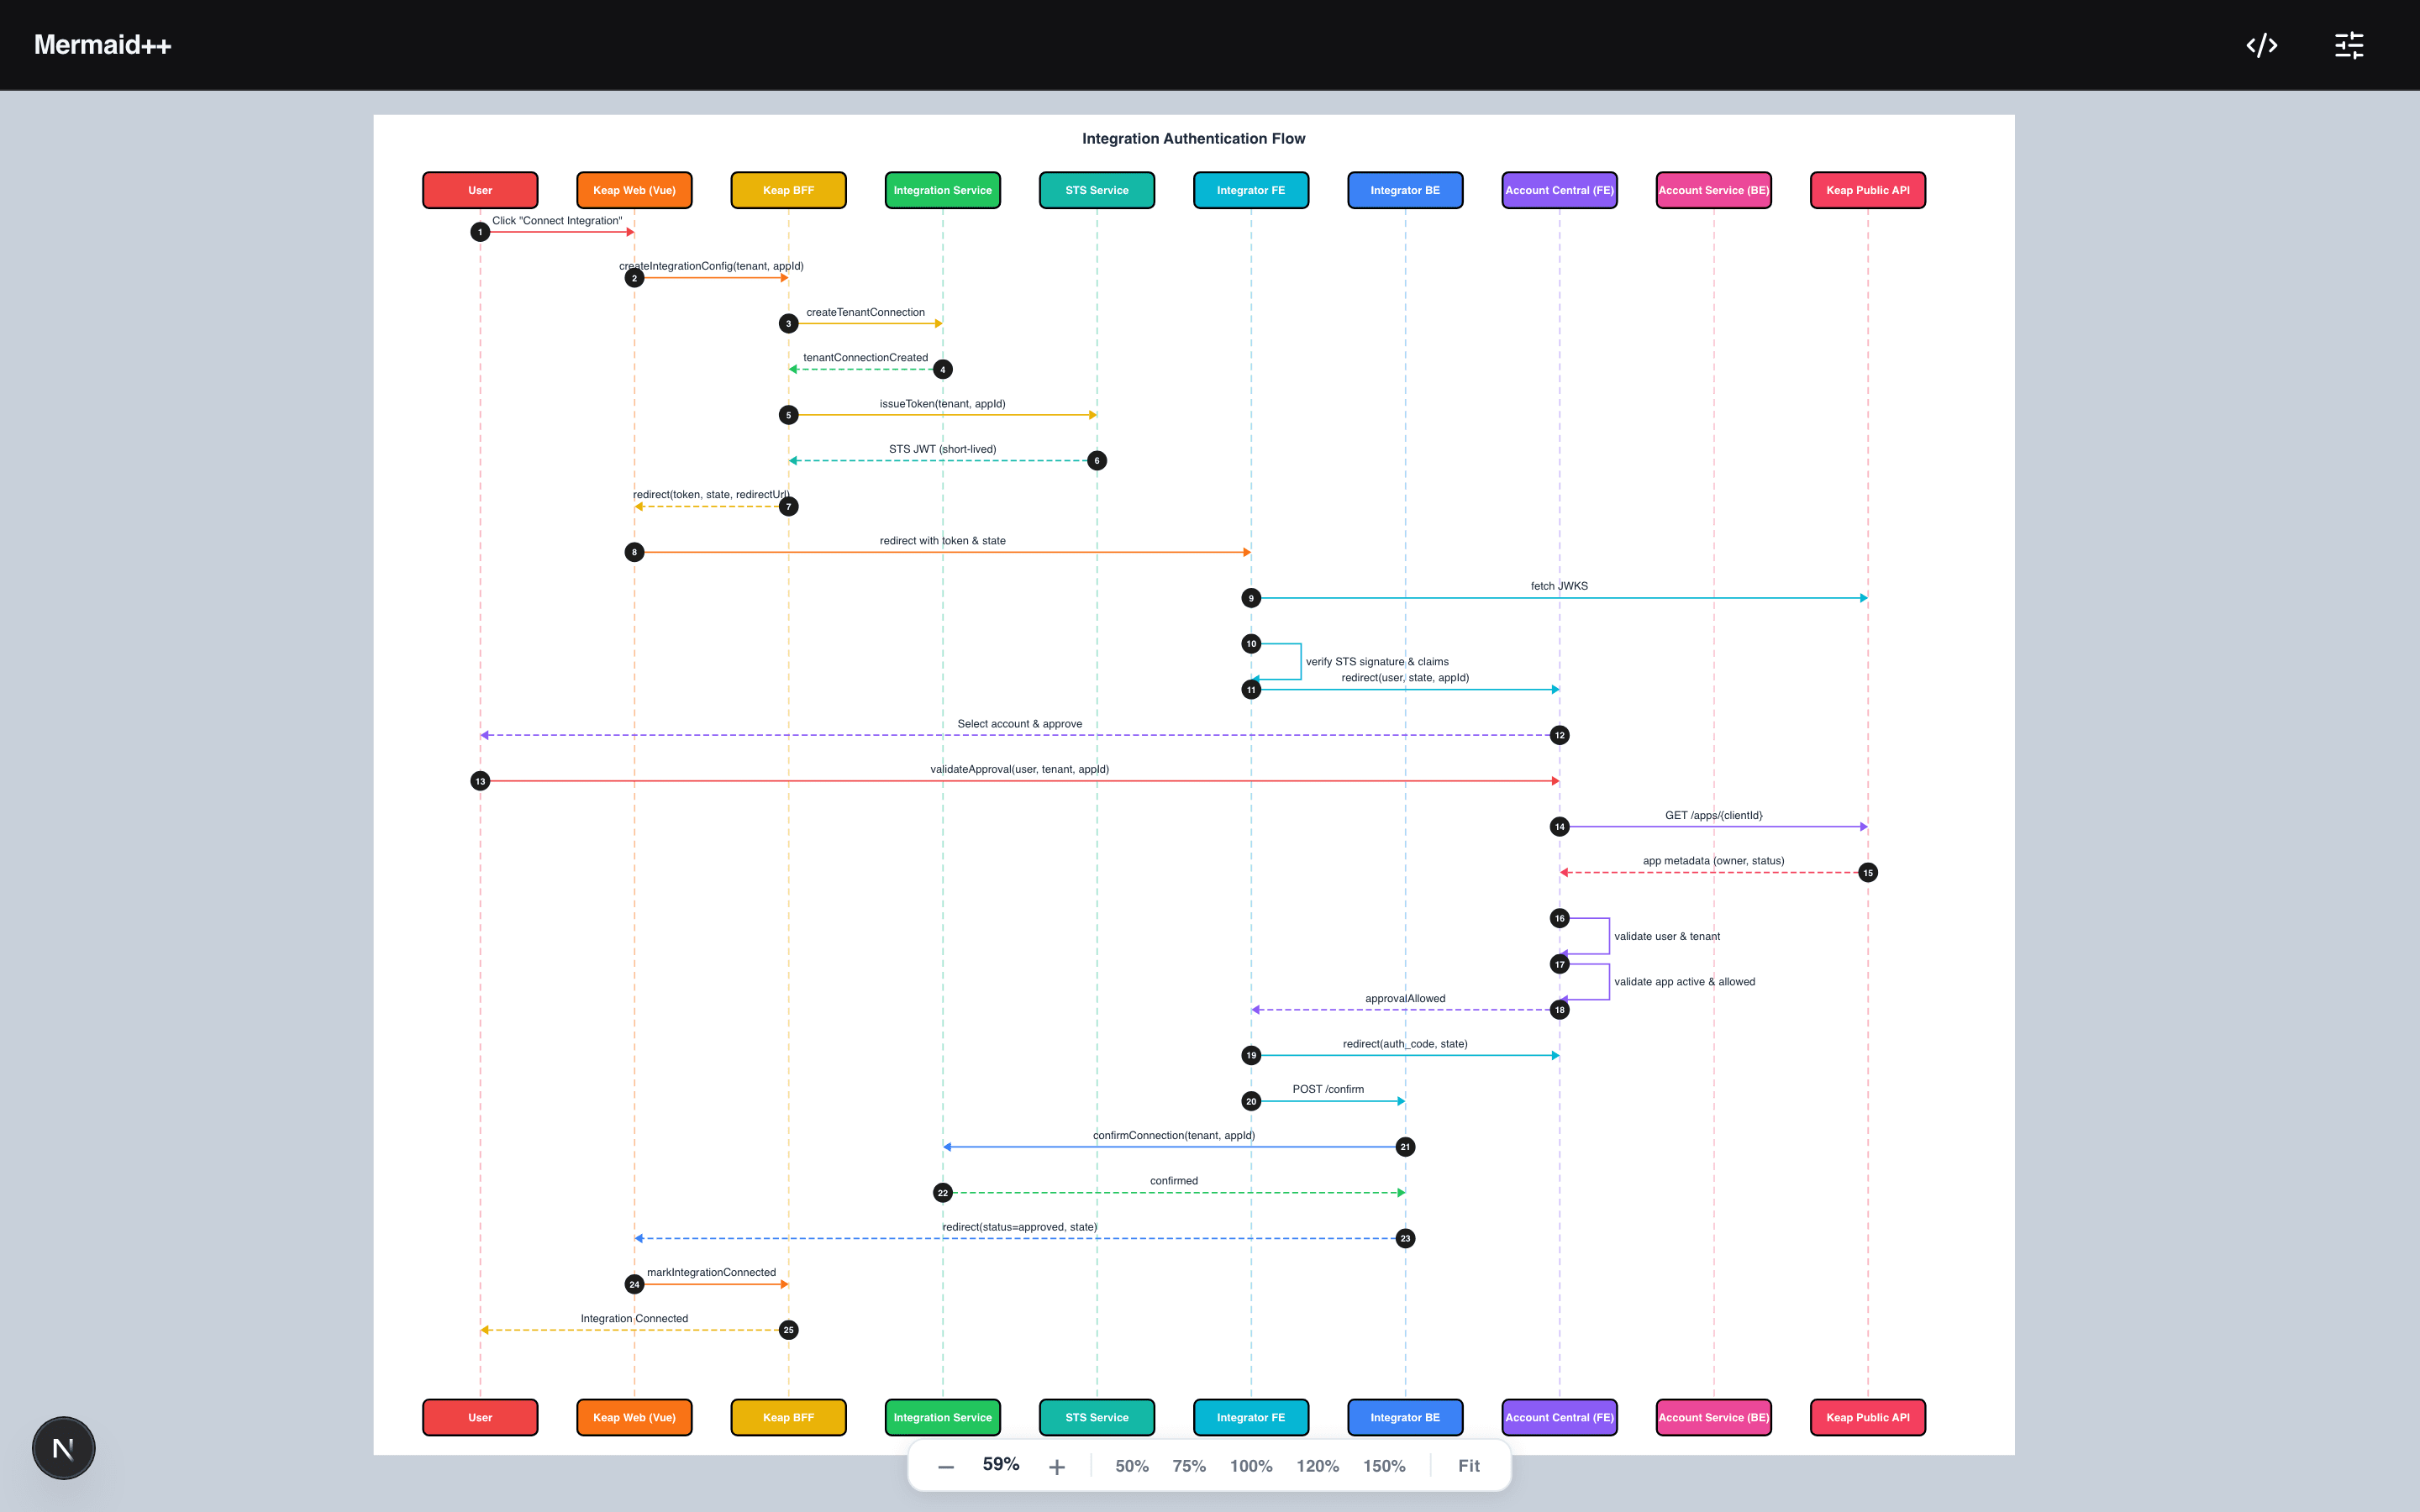
Handles arbitrarily nested JSON — arrays inside objects inside arrays. Every depth level gets its own horizontal layer. This one handles real-world API responses.
Features
- Real-time parsing — graph updates as you type
- Zoom & pan — ReactFlow's built-in controls
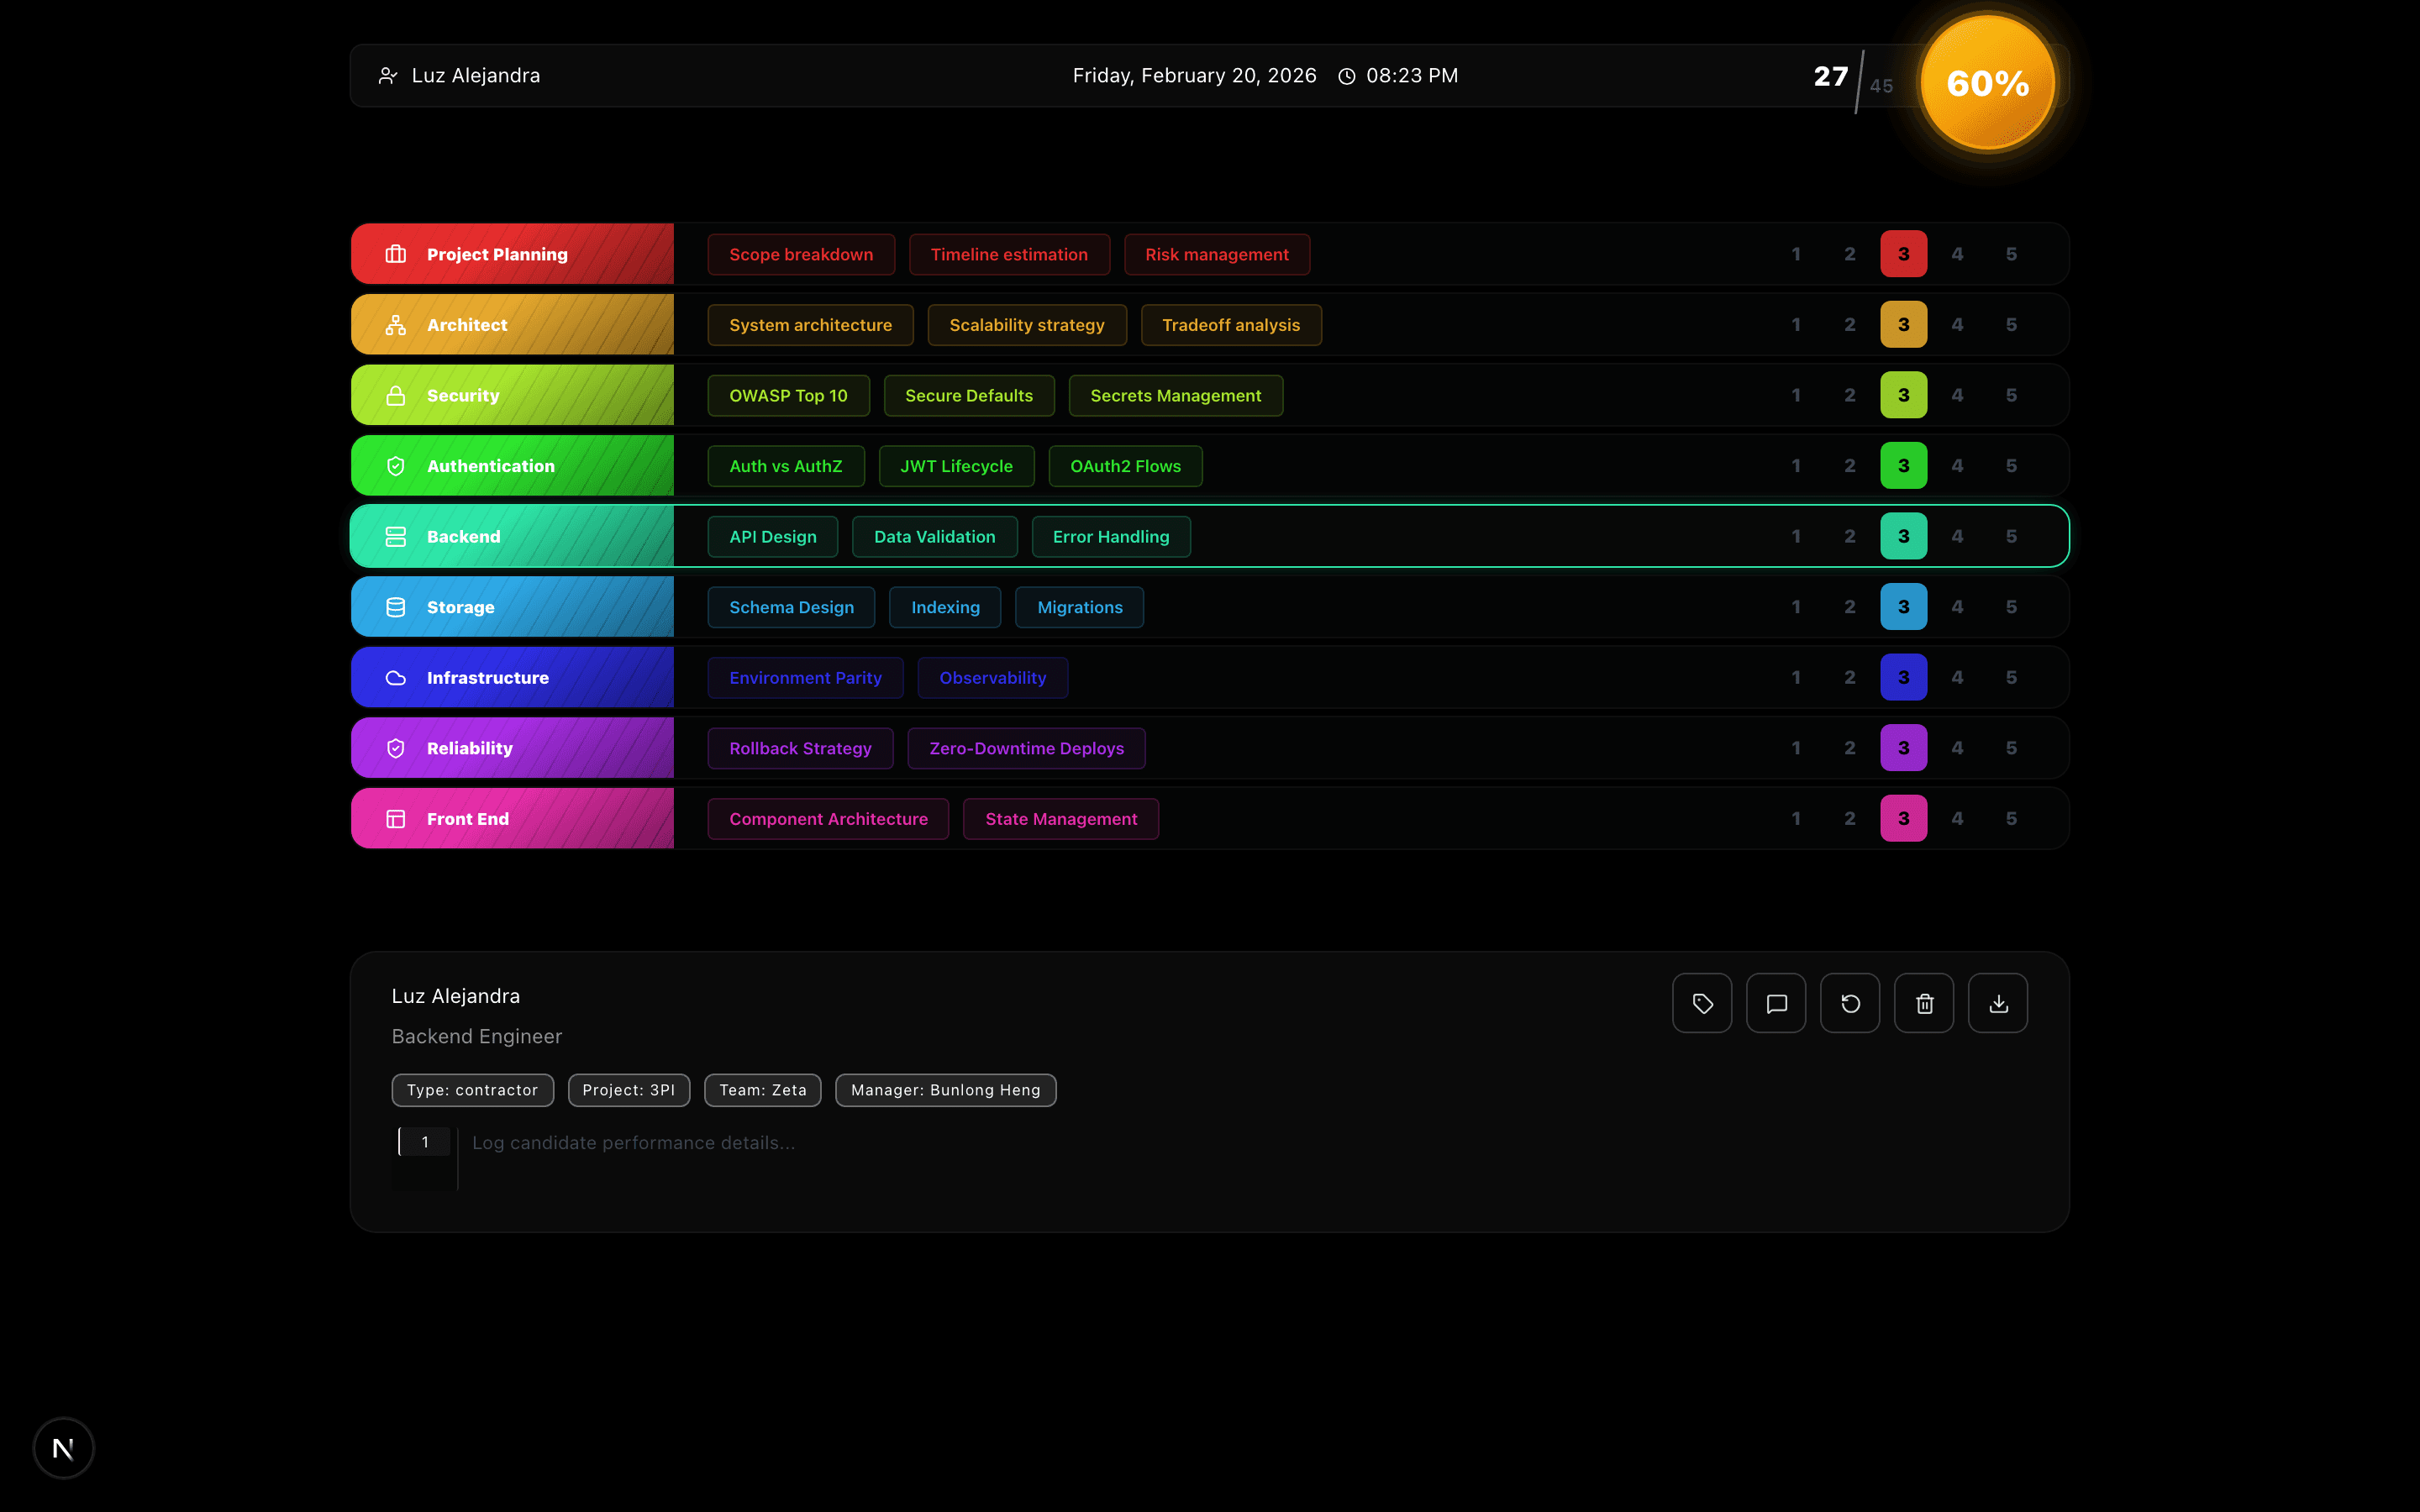
- Node colors — each node type (string, number, boolean, object, array) gets a distinct color
- Error tolerance — invalid JSON shows a parse error without crashing
- Minimap — navigate large graphs via thumbnail
Why three versions?
Each one was a learning iteration. Version 1 proved the concept. Version 2 improved edge routing. Version 3 handled the recursive case properly. Rather than delete the earlier ones, I kept all three — they show the evolution clearly and each has slightly different behavior that can be useful.
Screenshots


Comments
Be the first to leave a comment.
Related Posts